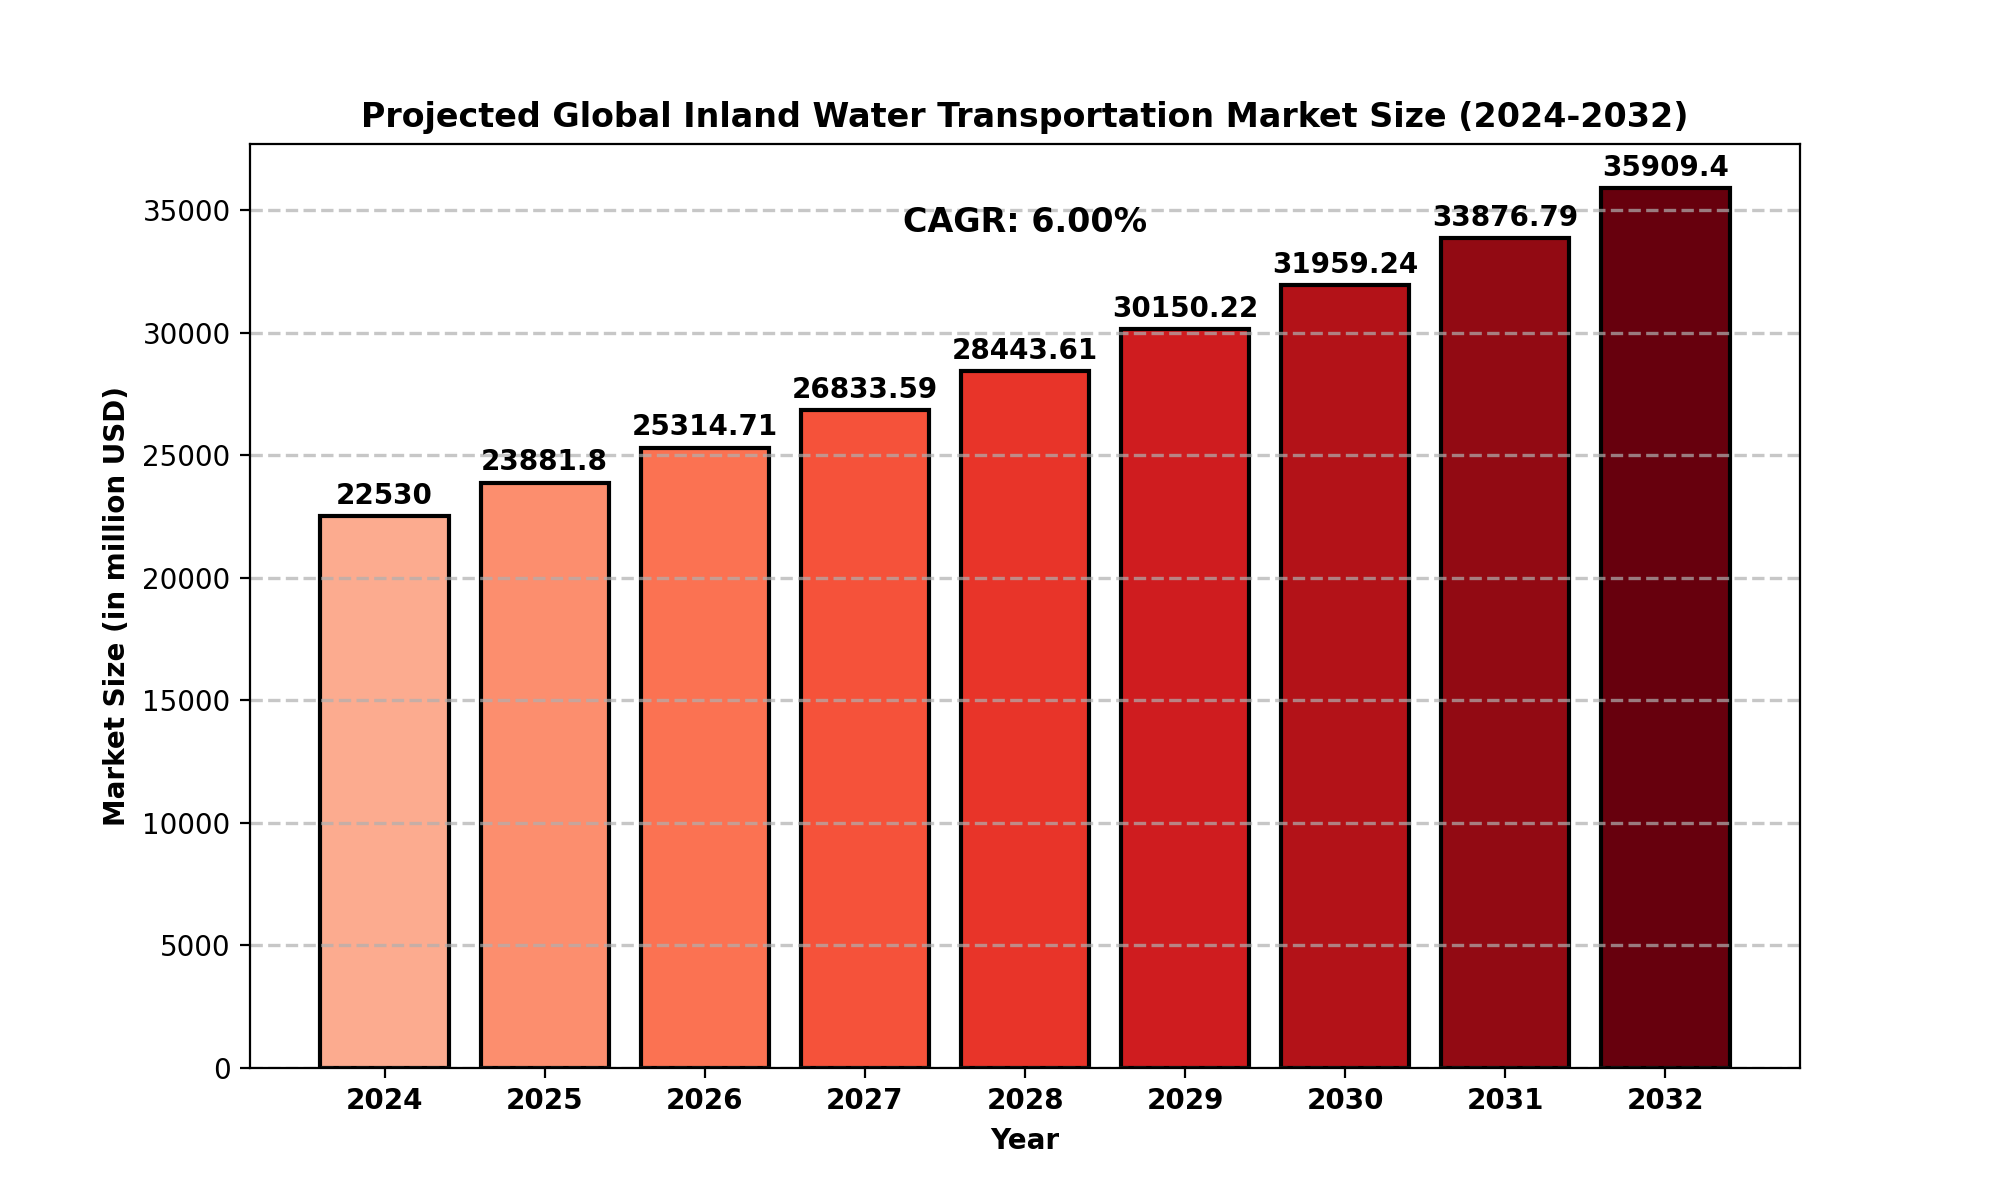
The global Inland Water Transportation market size was estimated at USD 22530 million in 2024 and is projected to reach USD 35909.4 million by 2032, exhibiting a CAGR of 6.00% during the forecast period.
North America Inland Water Transportation market size was estimated at USD 6490.04 million in 2024, at a CAGR of 5.14% during the forecast period of 2025 through 2032.
Report Overview
Inland water transport is a viable alternative or addition to road and rail transport on European corridors.
This report provides a deep insight into the global Inland Water Transportation market covering all its essential aspects. This ranges from a macro overview of the market to micro details of the market size, competitive landscape, development trend, niche market, key market drivers and challenges, SWOT analysis, value chain analysis, etc.
The analysis helps the reader to shape the competition within the industries and strategies for the competitive environment to enhance the potential profit. Furthermore, it provides a simple framework for evaluating and accessing the position of the business organization. The report structure also focuses on the competitive landscape of the Global Inland Water Transportation Market, this report introduces in detail the market share, market performance, product situation, operation situation, etc. of the main players, which helps the readers in the industry to identify the main competitors and deeply understand the competition pattern of the market.
In a word, this report is a must-read for industry players, investors, researchers, consultants, business strategists, and all those who have any kind of stake or are planning to foray into the Inland Water Transportation market in any manner.
Global Inland Water Transportation Market: Market Segmentation Analysis
The research report includes specific segments by region (country), manufacturers, Type, and Application. Market segmentation creates subsets of a market based on product type, end-user or application, Geographic, and other factors. By understanding the market segments, the decision-maker can leverage this targeting in the product, sales, and marketing strategies. Market segments can power your product development cycles by informing how you create product offerings for different segments.
Key Company
- American Commercial Lines
- Ingram Industries
- AP Moller - Maersk
- Jeffboat
- European Cruise
Market Segmentation (by Type)
- Inland Water Freight Transportation
- Inland Water Passenger Transportation
Market Segmentation (by Application)
- Supply Chain
- Distribution
- End Customers
Geographic Segmentation
- North America (USA, Canada, Mexico)
- Europe (Germany, UK, France, Russia, Italy, Rest of Europe)
- Asia-Pacific (China, Japan, South Korea, India, Southeast Asia, Rest of Asia-Pacific)
- South America (Brazil, Argentina, Columbia, Rest of South America)
- The Middle East and Africa (Saudi Arabia, UAE, Egypt, Nigeria, South Africa, Rest of MEA)
Key Benefits of This Market Research:
- Industry drivers, restraints, and opportunities covered in the study
- Neutral perspective on the market performance
- Recent industry trends and developments
- Competitive landscape & strategies of key players
- Potential & niche segments and regions exhibiting promising growth covered
- Historical, current, and projected market size, in terms of value
- In-depth analysis of the Inland Water Transportation Market
- Overview of the regional outlook of the Inland Water Transportation Market:
FAQs on the Global Inland Water Transportation Market (2024-2032)
1. What is the projected market size of the global Inland Water Transportation industry by 2032?
- The global Inland Water Transportation market is expected to grow from USD 22,530 million in 2024 to USD 38,063.96 million by 2032, with a CAGR of 6.00% during the forecast period.
2. What factors are driving the growth of the Inland Water Transportation market?
Key drivers of market growth include:
-
Increasing demand for cost-effective and fuel-efficient transportation.
-
Government initiatives to promote inland waterways for sustainable logistics.
-
Rising trade activities and industrialization in emerging economies.
-
Advancements in vessel technology for enhanced efficiency and safety.
3. What are the major challenges faced by the Inland Water Transportation industry?
Some key challenges include:
-
High initial infrastructure costs.
-
Seasonal limitations due to water levels and weather conditions.
-
Regulatory and environmental restrictions in certain regions.
-
Competition from other transportation modes like road and rail.
4. Which regions are leading in Inland Water Transportation market growth?
- The market is expanding globally, but Asia-Pacific, Europe, and North America are the key regions driving growth. Countries like China, India, Germany, and the U.S. are witnessing increased investments in inland waterways infrastructure.
5. How does Inland Water Transportation compare to other modes of transport?
Compared to road and rail, inland water transport is:
-
More fuel-efficient and environmentally friendly.
-
Cost-effective for bulk goods and heavy cargo.
-
Less congested, reducing traffic delays.
However, it may be slower than road or rail transport and depends on navigable waterways.
Key Reasons to Buy this Report:
- Access to date statistics compiled by our researchers. These provide you with historical and forecast data, which is analyzed to tell you why your market is set to change
- This enables you to anticipate market changes to remain ahead of your competitors
- You will be able to copy data from the Excel spreadsheet straight into your marketing plans, business presentations, or other strategic documents
- The concise analysis, clear graph, and table format will enable you to pinpoint the information you require quickly
- Provision of market value data for each segment and sub-segment
- Indicates the region and segment that is expected to witness the fastest growth as well as to dominate the market
- Analysis by geography highlighting the consumption of the product/service in the region as well as indicating the factors that are affecting the market within each region
- Competitive landscape which incorporates the market ranking of the major players, along with new service/product launches, partnerships, business expansions, and acquisitions in the past five years of companies profiled
- Extensive company profiles comprising of company overview, company insights, product benchmarking, and SWOT analysis for the major market players
- The current as well as the future market outlook of the industry concerning recent developments which involve growth opportunities and drivers as well as challenges and restraints of both emerging as well as developed regions
- Includes in-depth analysis of the market from various perspectives through Porters five forces analysis
- Provides insight into the market through Value Chain
- Market dynamics scenario, along with growth opportunities of the market in the years to come
- 6-month post-sales analyst support
Customization of the Report
- In case of any queries or customization requirements, please connect with our sales team, who will ensure that your requirements are met.
Chapter Outline
- Chapter 1 mainly introduces the statistical scope of the report, market division standards, and market research methods.
- Chapter 2 is an executive summary of different market segments (by region, product type, application, etc), including the market size of each market segment, future development potential, and so on. It offers a high-level view of the current state of the Inland Water Transportation Market and its likely evolution in the short to mid-term, and long term.
- Chapter 3 makes a detailed analysis of the market's competitive landscape of the market and provides the market share, capacity, output, price, latest development plan, merger, and acquisition information of the main manufacturers in the market.
- Chapter 4 is the analysis of the whole market industrial chain, including the upstream and downstream of the industry, as well as Porter's five forces analysis.
- Chapter 5 introduces the latest developments of the market, the driving factors and restrictive factors of the market, the challenges and risks faced by manufacturers in the industry, and the analysis of relevant policies in the industry.
- Chapter 6 provides the analysis of various market segments according to product types, covering the market size and development potential of each market segment, to help readers find the blue ocean market in different market segments.
- Chapter 7 provides the analysis of various market segments according to application, covering the market size and development potential of each market segment, to help readers find the blue ocean market in different downstream markets.
- Chapter 8 provides a quantitative analysis of the market size and development potential of each region from the consumer side and its main countries and introduces the market development, future development prospects, market space, and capacity of each country in the world.
- Chapter 9 shares the main producing countries of Inland Water Transportation, their output value, profit level, regional supply, production capacity layout, etc. from the supply side.
- Chapter 10 introduces the basic situation of the main companies in the market in detail, including product sales revenue, sales volume, price, gross profit margin, market share, product introduction, recent development, etc.
- Chapter 11 provides a quantitative analysis of the market size and development potential of each region during the forecast period.
- Chapter 12 provides a quantitative analysis of the market size and development potential of each market segment during the forecast period.
- Chapter 13 is the main points and conclusions of the report.
TABLE OF CONTENTS
Table of Contents
1 Research Methodology and Statistical Scope
1.1 Market Definition and Statistical Scope of Inland Water Transportation
1.2 Key Market Segments
1.2.1 Inland Water Transportation Segment by Type
1.2.2 Inland Water Transportation Segment by Application
1.3 Methodology & Sources of Information
1.3.1 Research Methodology
1.3.2 Research Process
1.3.3 Market Breakdown and Data Triangulation
1.3.4 Base Year
1.3.5 Report Assumptions & Caveats
1.4 Key Data of Global Auto Market
1.4.1 Global Automobile Production by Country
1.4.2 Global Automobile Production by Type
2 Inland Water Transportation Market Overview
2.1 Global Market Overview
2.1.1 Global Inland Water Transportation Market Size (M USD) Estimates and Forecasts (2019-2032)
2.1.2 Global Inland Water Transportation Sales Estimates and Forecasts (2019-2032)
2.2 Market Segment Executive Summary
2.3 Global Market Size by Region
3 Inland Water Transportation Market Competitive Landscape
3.1 Global Inland Water Transportation Sales by Manufacturers (2019-2025)
3.2 Global Inland Water Transportation Revenue Market Share by Manufacturers (2019-2025)
3.3 Inland Water Transportation Market Share by Company Type (Tier 1, Tier 2, and Tier 3)
3.4 Global Inland Water Transportation Average Price by Manufacturers (2019-2025)
3.5 Manufacturers Inland Water Transportation Sales Sites, Area Served, Product Type
3.6 Inland Water Transportation Market Competitive Situation and Trends
3.6.1 Inland Water Transportation Market Concentration Rate
3.6.2 Global 5 and 10 Largest Inland Water Transportation Players Market Share by Revenue
3.6.3 Mergers & Acquisitions, Expansion
4 Inland Water Transportation Industry Chain Analysis
4.1 Inland Water Transportation Industry Chain Analysis
4.2 Market Overview of Key Raw Materials
4.3 Midstream Market Analysis
4.4 Downstream Customer Analysis
5 The Development and Dynamics of Inland Water Transportation Market
5.1 Key Development Trends
5.2 Driving Factors
5.3 Market Challenges
5.4 Market Restraints
5.5 Industry News
5.5.1 New Product Developments
5.5.2 Mergers & Acquisitions
5.5.3 Expansions
5.5.4 Collaboration/Supply Contracts
5.6 Industry Policies
6 Inland Water Transportation Market Segmentation by Type
6.1 Evaluation Matrix of Segment Market Development Potential (Type)
6.2 Global Inland Water Transportation Sales Market Share by Type (2019-2025)
6.3 Global Inland Water Transportation Market Size Market Share by Type (2019-2025)
6.4 Global Inland Water Transportation Price by Type (2019-2025)
7 Inland Water Transportation Market Segmentation by Application
7.1 Evaluation Matrix of Segment Market Development Potential (Application)
7.2 Global Inland Water Transportation Market Sales by Application (2019-2025)
7.3 Global Inland Water Transportation Market Size (M USD) by Application (2019-2025)
7.4 Global Inland Water Transportation Sales Growth Rate by Application (2019-2025)
8 Inland Water Transportation Market Consumption by Region
8.1 Global Inland Water Transportation Sales by Region
8.1.1 Global Inland Water Transportation Sales by Region
8.1.2 Global Inland Water Transportation Sales Market Share by Region
8.2 North America
8.2.1 North America Inland Water Transportation Sales by Country
8.2.2 U.S.
8.2.3 Canada
8.2.4 Mexico
8.3 Europe
8.3.1 Europe Inland Water Transportation Sales by Country
8.3.2 Germany
8.3.3 France
8.3.4 U.K.
8.3.5 Italy
8.3.6 Russia
8.4 Asia Pacific
8.4.1 Asia Pacific Inland Water Transportation Sales by Region
8.4.2 China
8.4.3 Japan
8.4.4 South Korea
8.4.5 India
8.4.6 Southeast Asia
8.5 South America
8.5.1 South America Inland Water Transportation Sales by Country
8.5.2 Brazil
8.5.3 Argentina
8.5.4 Columbia
8.6 Middle East and Africa
8.6.1 Middle East and Africa Inland Water Transportation Sales by Region
8.6.2 Saudi Arabia
8.6.3 UAE
8.6.4 Egypt
8.6.5 Nigeria
8.6.6 South Africa
9 Inland Water Transportation Market Production by Region
9.1 Global Production of Inland Water Transportation by Region (2019-2025)
9.2 Global Inland Water Transportation Revenue Market Share by Region (2019-2025)
9.3 Global Inland Water Transportation Production, Revenue, Price and Gross Margin (2019-2025)
9.4 North America Inland Water Transportation Production
9.4.1 North America Inland Water Transportation Production Growth Rate (2019-2025)
9.4.2 North America Inland Water Transportation Production, Revenue, Price and Gross Margin (2019-2025)
9.5 Europe Inland Water Transportation Production
9.5.1 Europe Inland Water Transportation Production Growth Rate (2019-2025)
9.5.2 Europe Inland Water Transportation Production, Revenue, Price and Gross Margin (2019-2025)
9.6 Japan Inland Water Transportation Production (2019-2025)
9.6.1 Japan Inland Water Transportation Production Growth Rate (2019-2025)
9.6.2 Japan Inland Water Transportation Production, Revenue, Price and Gross Margin (2019-2025)
9.7 China Inland Water Transportation Production (2019-2025)
9.7.1 China Inland Water Transportation Production Growth Rate (2019-2025)
9.7.2 China Inland Water Transportation Production, Revenue, Price and Gross Margin (2019-2025)
10 Key Companies Profile
10.1 American Commercial Lines
10.1.1 American Commercial Lines Inland Water Transportation Basic Information
10.1.2 American Commercial Lines Inland Water Transportation Product Overview
10.1.3 American Commercial Lines Inland Water Transportation Product Market Performance
10.1.4 American Commercial Lines Business Overview
10.1.5 American Commercial Lines Inland Water Transportation SWOT Analysis
10.1.6 American Commercial Lines Recent Developments
10.2 Ingram Industries
10.2.1 Ingram Industries Inland Water Transportation Basic Information
10.2.2 Ingram Industries Inland Water Transportation Product Overview
10.2.3 Ingram Industries Inland Water Transportation Product Market Performance
10.2.4 Ingram Industries Business Overview
10.2.5 Ingram Industries Inland Water Transportation SWOT Analysis
10.2.6 Ingram Industries Recent Developments
10.3 AP Moller - Maersk
10.3.1 AP Moller - Maersk Inland Water Transportation Basic Information
10.3.2 AP Moller - Maersk Inland Water Transportation Product Overview
10.3.3 AP Moller - Maersk Inland Water Transportation Product Market Performance
10.3.4 AP Moller - Maersk Inland Water Transportation SWOT Analysis
10.3.5 AP Moller - Maersk Business Overview
10.3.6 AP Moller - Maersk Recent Developments
10.4 Jeffboat
10.4.1 Jeffboat Inland Water Transportation Basic Information
10.4.2 Jeffboat Inland Water Transportation Product Overview
10.4.3 Jeffboat Inland Water Transportation Product Market Performance
10.4.4 Jeffboat Business Overview
10.4.5 Jeffboat Recent Developments
10.5 European Cruise
10.5.1 European Cruise Inland Water Transportation Basic Information
10.5.2 European Cruise Inland Water Transportation Product Overview
10.5.3 European Cruise Inland Water Transportation Product Market Performance
10.5.4 European Cruise Business Overview
10.5.5 European Cruise Recent Developments
11 Inland Water Transportation Market Forecast by Region
11.1 Global Inland Water Transportation Market Size Forecast
11.2 Global Inland Water Transportation Market Forecast by Region
11.2.1 North America Market Size Forecast by Country
11.2.2 Europe Inland Water Transportation Market Size Forecast by Country
11.2.3 Asia Pacific Inland Water Transportation Market Size Forecast by Region
11.2.4 South America Inland Water Transportation Market Size Forecast by Country
11.2.5 Middle East and Africa Forecasted Consumption of Inland Water Transportation by Country
12 Forecast Market by Type and by Application (2025-2032)
12.1 Global Inland Water Transportation Market Forecast by Type (2025-2032)
12.1.1 Global Forecasted Sales of Inland Water Transportation by Type (2025-2032)
12.1.2 Global Inland Water Transportation Market Size Forecast by Type (2025-2032)
12.1.3 Global Forecasted Price of Inland Water Transportation by Type (2025-2032)
12.2 Global Inland Water Transportation Market Forecast by Application (2025-2032)
12.2.1 Global Inland Water Transportation Sales (K Units) Forecast by Application
12.2.2 Global Inland Water Transportation Market Size (M USD) Forecast by Application (2025-2032)
13 Conclusion and Key Findings
LIST OF TABLES & FIGURES
List of Tables
Table 1. Introduction of the Type
Table 2. Introduction of the Application
Table 3. Motor Vehicle Production Market Share by Type (2023)
Table 4. Global Automobile Production by Region (Units)
Table 5. Market Share and Development Potential of Automobiles by Region
Table 6. Global Automobile Production by Country (Vehicle)
Table 7. Market Share and Development Potential of Automobiles by Countries
Table 8. Global Automobile Production by Type
Table 9. Market Share and Development Potential of Automobiles by Type
Table 10. Market Size (M USD) Segment Executive Summary
Table 11. Inland Water Transportation Market Size Comparison by Region (M USD)
Table 12. Global Inland Water Transportation Sales (K Units) by Manufacturers (2019-2025)
Table 13. Global Inland Water Transportation Sales Market Share by Manufacturers (2019-2025)
Table 14. Global Inland Water Transportation Revenue (M USD) by Manufacturers (2019-2025)
Table 15. Global Inland Water Transportation Revenue Share by Manufacturers (2019-2025)
Table 16. Company Type (Tier 1, Tier 2, and Tier 3) & (based on the Revenue in Inland Water Transportation as of 2022)
Table 17. Global Market Inland Water Transportation Average Price (USD/Unit) of Key Manufacturers (2019-2025)
Table 18. Manufacturers Inland Water Transportation Sales Sites and Area Served
Table 19. Manufacturers Inland Water Transportation Product Type
Table 20. Global Inland Water Transportation Manufacturers Market Concentration Ratio (CR5 and HHI)
Table 21. Mergers & Acquisitions, Expansion Plans
Table 22. Industry Chain Map of Inland Water Transportation
Table 23. Market Overview of Key Raw Materials
Table 24. Midstream Market Analysis
Table 25. Downstream Customer Analysis
Table 26. Key Development Trends
Table 27. Driving Factors
Table 28. Inland Water Transportation Market Challenges
Table 29. Global Inland Water Transportation Sales by Type (K Units)
Table 30. Global Inland Water Transportation Market Size by Type (M USD)
Table 31. Global Inland Water Transportation Sales (K Units) by Type (2019-2025)
Table 32. Global Inland Water Transportation Sales Market Share by Type (2019-2025)
Table 33. Global Inland Water Transportation Market Size (M USD) by Type (2019-2025)
Table 34. Global Inland Water Transportation Market Size Share by Type (2019-2025)
Table 35. Global Inland Water Transportation Price (USD/Unit) by Type (2019-2025)
Table 36. Global Inland Water Transportation Sales (K Units) by Application
Table 37. Global Inland Water Transportation Market Size by Application
Table 38. Global Inland Water Transportation Sales by Application (2019-2025) & (K Units)
Table 39. Global Inland Water Transportation Sales Market Share by Application (2019-2025)
Table 40. Global Inland Water Transportation Sales by Application (2019-2025) & (M USD)
Table 41. Global Inland Water Transportation Market Share by Application (2019-2025)
Table 42. Global Inland Water Transportation Sales Growth Rate by Application (2019-2025)
Table 43. Global Inland Water Transportation Sales by Region (2019-2025) & (K Units)
Table 44. Global Inland Water Transportation Sales Market Share by Region (2019-2025)
Table 45. North America Inland Water Transportation Sales by Country (2019-2025) & (K Units)
Table 46. Europe Inland Water Transportation Sales by Country (2019-2025) & (K Units)
Table 47. Asia Pacific Inland Water Transportation Sales by Region (2019-2025) & (K Units)
Table 48. South America Inland Water Transportation Sales by Country (2019-2025) & (K Units)
Table 49. Middle East and Africa Inland Water Transportation Sales by Region (2019-2025) & (K Units)
Table 50. Global Inland Water Transportation Production (K Units) by Region (2019-2025)
Table 51. Global Inland Water Transportation Revenue (US$ Million) by Region (2019-2025)
Table 52. Global Inland Water Transportation Revenue Market Share by Region (2019-2025)
Table 53. Global Inland Water Transportation Production (K Units), Revenue (US$ Million), Price (USD/Unit) and Gross Margin (2019-2025)
Table 54. North America Inland Water Transportation Production (K Units), Revenue (US$ Million), Price (USD/Unit) and Gross Margin (2019-2025)
Table 55. Europe Inland Water Transportation Production (K Units), Revenue (US$ Million), Price (USD/Unit) and Gross Margin (2019-2025)
Table 56. Japan Inland Water Transportation Production (K Units), Revenue (US$ Million), Price (USD/Unit) and Gross Margin (2019-2025)
Table 57. China Inland Water Transportation Production (K Units), Revenue (US$ Million), Price (USD/Unit) and Gross Margin (2019-2025)
Table 58. American Commercial Lines Inland Water Transportation Basic Information
Table 59. American Commercial Lines Inland Water Transportation Product Overview
Table 60. American Commercial Lines Inland Water Transportation Sales (K Units), Revenue (M USD), Price (USD/Unit) and Gross Margin (2019-2025)
Table 61. American Commercial Lines Business Overview
Table 62. American Commercial Lines Inland Water Transportation SWOT Analysis
Table 63. American Commercial Lines Recent Developments
Table 64. Ingram Industries Inland Water Transportation Basic Information
Table 65. Ingram Industries Inland Water Transportation Product Overview
Table 66. Ingram Industries Inland Water Transportation Sales (K Units), Revenue (M USD), Price (USD/Unit) and Gross Margin (2019-2025)
Table 67. Ingram Industries Business Overview
Table 68. Ingram Industries Inland Water Transportation SWOT Analysis
Table 69. Ingram Industries Recent Developments
Table 70. AP Moller - Maersk Inland Water Transportation Basic Information
Table 71. AP Moller - Maersk Inland Water Transportation Product Overview
Table 72. AP Moller - Maersk Inland Water Transportation Sales (K Units), Revenue (M USD), Price (USD/Unit) and Gross Margin (2019-2025)
Table 73. AP Moller - Maersk Inland Water Transportation SWOT Analysis
Table 74. AP Moller - Maersk Business Overview
Table 75. AP Moller - Maersk Recent Developments
Table 76. Jeffboat Inland Water Transportation Basic Information
Table 77. Jeffboat Inland Water Transportation Product Overview
Table 78. Jeffboat Inland Water Transportation Sales (K Units), Revenue (M USD), Price (USD/Unit) and Gross Margin (2019-2025)
Table 79. Jeffboat Business Overview
Table 80. Jeffboat Recent Developments
Table 81. European Cruise Inland Water Transportation Basic Information
Table 82. European Cruise Inland Water Transportation Product Overview
Table 83. European Cruise Inland Water Transportation Sales (K Units), Revenue (M USD), Price (USD/Unit) and Gross Margin (2019-2025)
Table 84. European Cruise Business Overview
Table 85. European Cruise Recent Developments
Table 86. Global Inland Water Transportation Sales Forecast by Region (2025-2032) & (K Units)
Table 87. Global Inland Water Transportation Market Size Forecast by Region (2025-2032) & (M USD)
Table 88. North America Inland Water Transportation Sales Forecast by Country (2025-2032) & (K Units)
Table 89. North America Inland Water Transportation Market Size Forecast by Country (2025-2032) & (M USD)
Table 90. Europe Inland Water Transportation Sales Forecast by Country (2025-2032) & (K Units)
Table 91. Europe Inland Water Transportation Market Size Forecast by Country (2025-2032) & (M USD)
Table 92. Asia Pacific Inland Water Transportation Sales Forecast by Region (2025-2032) & (K Units)
Table 93. Asia Pacific Inland Water Transportation Market Size Forecast by Region (2025-2032) & (M USD)
Table 94. South America Inland Water Transportation Sales Forecast by Country (2025-2032) & (K Units)
Table 95. South America Inland Water Transportation Market Size Forecast by Country (2025-2032) & (M USD)
Table 96. Middle East and Africa Inland Water Transportation Consumption Forecast by Country (2025-2032) & (Units)
Table 97. Middle East and Africa Inland Water Transportation Market Size Forecast by Country (2025-2032) & (M USD)
Table 98. Global Inland Water Transportation Sales Forecast by Type (2025-2032) & (K Units)
Table 99. Global Inland Water Transportation Market Size Forecast by Type (2025-2032) & (M USD)
Table 100. Global Inland Water Transportation Price Forecast by Type (2025-2032) & (USD/Unit)
Table 101. Global Inland Water Transportation Sales (K Units) Forecast by Application (2025-2032)
Table 102. Global Inland Water Transportation Market Size Forecast by Application (2025-2032) & (M USD)
List of Figures
Figure 1. Product Picture of Inland Water Transportation
Figure 2. Data Triangulation
Figure 3. Key Caveats
Figure 4. Global Motor Vehicle Production (M Units)
Figure 5. Global Inland Water Transportation Market Size (M USD), 2019-2032
Figure 6. Global Inland Water Transportation Market Size (M USD) (2019-2032)
Figure 7. Global Inland Water Transportation Sales (K Units) & (2019-2032)
Figure 8. Evaluation Matrix of Segment Market Development Potential (Type)
Figure 9. Evaluation Matrix of Segment Market Development Potential (Application)
Figure 10. Evaluation Matrix of Regional Market Development Potential
Figure 11. Inland Water Transportation Market Size by Country (M USD)
Figure 12. Inland Water Transportation Sales Share by Manufacturers in 2023
Figure 13. Global Inland Water Transportation Revenue Share by Manufacturers in 2023
Figure 14. Inland Water Transportation Market Share by Company Type (Tier 1, Tier 2 and Tier 3): 2023
Figure 15. Global Market Inland Water Transportation Average Price (USD/Unit) of Key Manufacturers in 2023
Figure 16. The Global 5 and 10 Largest Players: Market Share by Inland Water Transportation Revenue in 2023
Figure 17. Evaluation Matrix of Segment Market Development Potential (Type)
Figure 18. Global Inland Water Transportation Market Share by Type
Figure 19. Sales Market Share of Inland Water Transportation by Type (2019-2025)
Figure 20. Sales Market Share of Inland Water Transportation by Type in 2023
Figure 21. Market Size Share of Inland Water Transportation by Type (2019-2025)
Figure 22. Market Size Market Share of Inland Water Transportation by Type in 2023
Figure 23. Evaluation Matrix of Segment Market Development Potential (Application)
Figure 24. Global Inland Water Transportation Market Share by Application
Figure 25. Global Inland Water Transportation Sales Market Share by Application (2019-2025)
Figure 26. Global Inland Water Transportation Sales Market Share by Application in 2023
Figure 27. Global Inland Water Transportation Market Share by Application (2019-2025)
Figure 28. Global Inland Water Transportation Market Share by Application in 2023
Figure 29. Global Inland Water Transportation Sales Growth Rate by Application (2019-2025)
Figure 30. Global Inland Water Transportation Sales Market Share by Region (2019-2025)
Figure 31. North America Inland Water Transportation Sales and Growth Rate (2019-2025) & (K Units)
Figure 32. North America Inland Water Transportation Sales Market Share by Country in 2023
Figure 33. U.S. Inland Water Transportation Sales and Growth Rate (2019-2025) & (K Units)
Figure 34. Canada Inland Water Transportation Sales (K Units) and Growth Rate (2019-2025)
Figure 35. Mexico Inland Water Transportation Sales (Units) and Growth Rate (2019-2025)
Figure 36. Europe Inland Water Transportation Sales and Growth Rate (2019-2025) & (K Units)
Figure 37. Europe Inland Water Transportation Sales Market Share by Country in 2023
Figure 38. Germany Inland Water Transportation Sales and Growth Rate (2019-2025) & (K Units)
Figure 39. France Inland Water Transportation Sales and Growth Rate (2019-2025) & (K Units)
Figure 40. U.K. Inland Water Transportation Sales and Growth Rate (2019-2025) & (K Units)
Figure 41. Italy Inland Water Transportation Sales and Growth Rate (2019-2025) & (K Units)
Figure 42. Russia Inland Water Transportation Sales and Growth Rate (2019-2025) & (K Units)
Figure 43. Asia Pacific Inland Water Transportation Sales and Growth Rate (K Units)
Figure 44. Asia Pacific Inland Water Transportation Sales Market Share by Region in 2023
Figure 45. China Inland Water Transportation Sales and Growth Rate (2019-2025) & (K Units)
Figure 46. Japan Inland Water Transportation Sales and Growth Rate (2019-2025) & (K Units)
Figure 47. South Korea Inland Water Transportation Sales and Growth Rate (2019-2025) & (K Units)
Figure 48. India Inland Water Transportation Sales and Growth Rate (2019-2025) & (K Units)
Figure 49. Southeast Asia Inland Water Transportation Sales and Growth Rate (2019-2025) & (K Units)
Figure 50. South America Inland Water Transportation Sales and Growth Rate (K Units)
Figure 51. South America Inland Water Transportation Sales Market Share by Country in 2023
Figure 52. Brazil Inland Water Transportation Sales and Growth Rate (2019-2025) & (K Units)
Figure 53. Argentina Inland Water Transportation Sales and Growth Rate (2019-2025) & (K Units)
Figure 54. Columbia Inland Water Transportation Sales and Growth Rate (2019-2025) & (K Units)
Figure 55. Middle East and Africa Inland Water Transportation Sales and Growth Rate (K Units)
Figure 56. Middle East and Africa Inland Water Transportation Sales Market Share by Region in 2023
Figure 57. Saudi Arabia Inland Water Transportation Sales and Growth Rate (2019-2025) & (K Units)
Figure 58. UAE Inland Water Transportation Sales and Growth Rate (2019-2025) & (K Units)
Figure 59. Egypt Inland Water Transportation Sales and Growth Rate (2019-2025) & (K Units)
Figure 60. Nigeria Inland Water Transportation Sales and Growth Rate (2019-2025) & (K Units)
Figure 61. South Africa Inland Water Transportation Sales and Growth Rate (2019-2025) & (K Units)
Figure 62. Global Inland Water Transportation Production Market Share by Region (2019-2025)
Figure 63. North America Inland Water Transportation Production (K Units) Growth Rate (2019-2025)
Figure 64. Europe Inland Water Transportation Production (K Units) Growth Rate (2019-2025)
Figure 65. Japan Inland Water Transportation Production (K Units) Growth Rate (2019-2025)
Figure 66. China Inland Water Transportation Production (K Units) Growth Rate (2019-2025)
Figure 67. Global Inland Water Transportation Sales Forecast by Volume (2019-2032) & (K Units)
Figure 68. Global Inland Water Transportation Market Size Forecast by Value (2019-2032) & (M USD)
Figure 69. Global Inland Water Transportation Sales Market Share Forecast by Type (2025-2032)
Figure 70. Global Inland Water Transportation Market Share Forecast by Type (2025-2032)
Figure 71. Global Inland Water Transportation Sales Forecast by Application (2025-2032)
Figure 72. Global Inland Water Transportation Market Share Forecast by Application (2025-2032)

