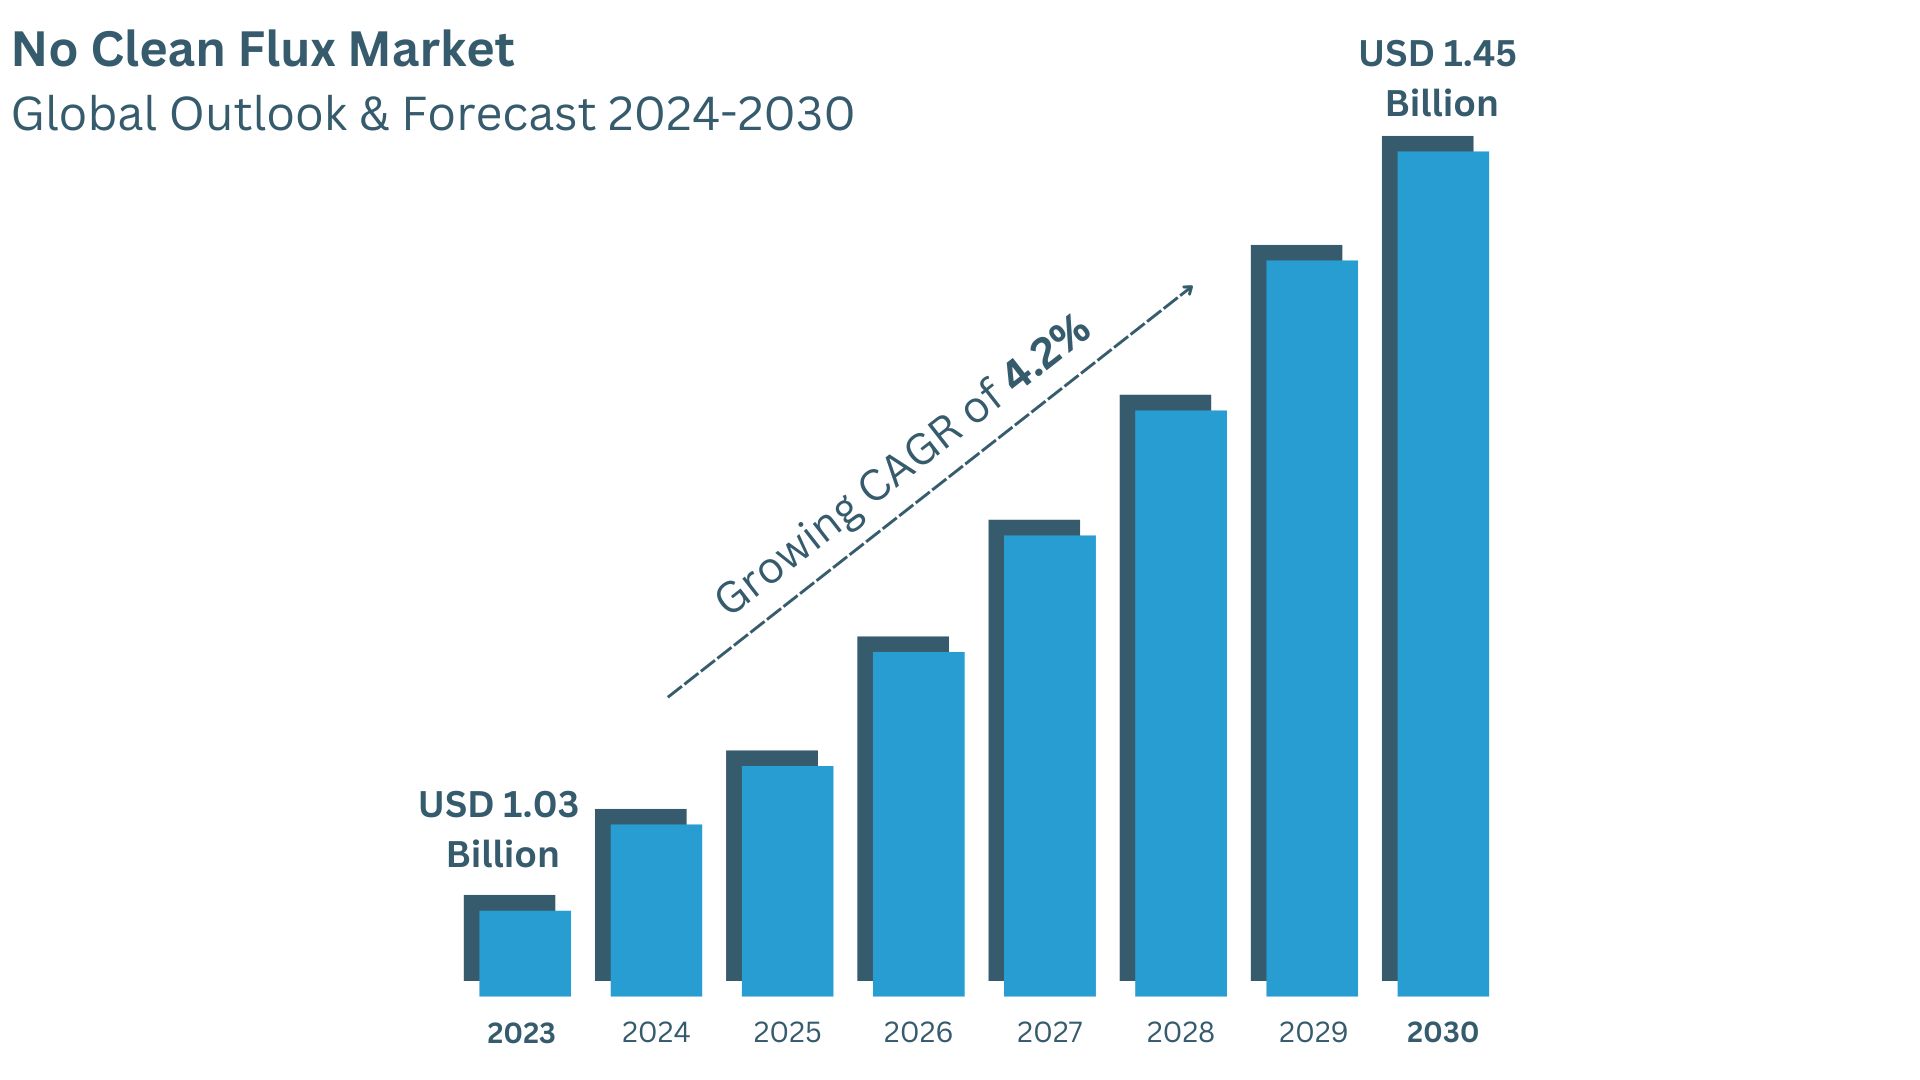
The global no clean flux market was valued at USD 1.03 billion in 2023 and is projected to reach USD 1.45 billion by 2030, growing at a Compound Annual Growth Rate (CAGR) of 4.2% during the forecast period (2024-2030). The influence of COVID-19 and the Russia-Ukraine War were considered while estimating market sizes.
No clean flux refers to a type of flux used in soldering processes that is designed to leave minimal residue after soldering is completed. Flux is a chemical substance used to clean and prepare metal surfaces for soldering by preventing oxidation and promoting solder wetting.
No clean flux is formulated with ingredients that minimize the formation of residues during soldering. Unlike traditional fluxes that require thorough cleaning after soldering to remove potentially corrosive residues, no clean flux is designed to leave behind a residue that is non-corrosive and non-conductive. This residue is generally considered safe to leave on the circuit board without compromising its performance or reliability. Therefore, no clean flux is particularly useful in applications where thorough post-solder cleaning may be challenging or impractical, such as in high-volume electronics manufacturing or where components are sensitive to moisture or cleaning agents.
Impact of COVID-19: The estimation of market sizes considered the influence of the COVID-19 pandemic, which disrupted supply chains and manufacturing operations, affecting market growth and demand.
Russia-Ukraine War Influence: Geopolitical factors such as the Russia-Ukraine war were taken into account, potentially impacting raw material supply chains and market stability.
Market Drivers: Increasing adoption of no clean flux in electronics manufacturing due to its benefits such as reduced cleaning requirements, lower environmental impact, and improved solder joint reliability is driving market growth.
Technological Advancements: Continuous advancements in soldering technologies and formulations of no clean flux to meet evolving industry standards and performance requirements are enhancing market attractiveness.
Application Diversity: No clean flux is widely used in various applications including printed circuit board (PCB) assembly, semiconductor packaging, and automotive electronics, contributing to market expansion.
Environmental Regulations: Compliance with stringent environmental regulations regarding the use and disposal of soldering materials is shaping product development and market strategies.
Challenges: Despite growth prospects, challenges such as competition from alternative flux types, variability in quality standards across regions, and price volatility of raw materials could impact market dynamics.
The global key manufacturers of No Clean Flux include Senju, Alent (Alpha), Tamura, Henkel, Indium, Kester, Shengmao, Inventec and AIM Solder, etc. in 2023, the global top five players have a share approximately % in terms of revenue.
This report aims to provide a comprehensive presentation of the global market for No Clean Flux, with both quantitative and qualitative analysis, to help readers develop business/growth strategies, assess the market competitive situation, analyze their position in the current marketplace, and make informed business decisions regarding No Clean Flux. This report contains market size and forecasts of No Clean Flux in global, including the following market information:
- Global No Clean Flux Market Revenue, 2019-2024, 2025-2030, ($ millions)
- Global No Clean Flux Market Sales, 2019-2024, 2025-2030, (Tons)
- Global top five No Clean Flux companies in 2023 (%)
MARKET MONITOR GLOBAL, INC (MMG) has surveyed the No Clean Flux manufacturers, suppliers, distributors and industry experts on this industry, involving the sales, revenue, demand, price change, product type, recent development and plan, industry trends, drivers, challenges, obstacles, and potential risks.
Total Market by Segment:
Global No Clean Flux Market, by Type, 2019-2024, 2025-2030 ($ Millions) & (Tons)
Global No Clean Flux Market Segment Percentages, by Type, 2023 (%)
Global No Clean Flux Market, by Application, 2019-2024, 2025-2030 ($ Millions) & (Tons)
Global No Clean Flux Market Segment Percentages, by Application, 2023 (%)
- Wave Soldering
- Selective Soldering
- Hand Soldering
Global No Clean Flux Market, By Region and Country, 2019-2024, 2025-2030 ($ Millions) & (Tons)
Global No Clean Flux Market Segment Percentages, By Region and Country, 2023 (%)
- North America (United States, Canada, Mexico)
- Europe (Germany, France, United Kingdom, Italy, Spain, Rest of Europe)
- Asia-Pacific (China, India, Japan, South Korea, Australia, Rest of APAC)
- The Middle East and Africa (Middle East, Africa)
- South and Central America (Brazil, Argentina, Rest of SCA)
Competitor Analysis
The report also provides analysis of leading market participants including:
- Key companies No Clean Flux revenues in global market, 2019-2024 (Estimated), ($ millions)
- Key companies No Clean Flux revenues share in global market, 2023 (%)
- Key companies No Clean Flux sales in global market, 2019-2024 (Estimated), (Tons)
- Key companies No Clean Flux sales share in global market, 2023 (%)
Further, the report presents profiles of competitors in the market, key players include:
- Senju
- Alent (Alpha)
- Tamura
- Henkel
- Indium
- Kester
- Shengmao
- Inventec
- AIM Solder
- MG Chemicals
- Chemtronics
Outline of Major Chapters:
Chapter 1: Introduces the definition of No Clean Flux, market overview.
Chapter 2: Global No Clean Flux market size in revenue and volume.
Chapter 3: Detailed analysis of No Clean Flux manufacturers competitive landscape, price, sales and revenue market share, latest development plan, merger, and acquisition information, etc.
Chapter 4: Provides the analysis of various market segments by type, covering the market size and development potential of each market segment, to help readers find the blue ocean market in different market segments.
Chapter 5: Provides the analysis of various market segments by application, covering the market size and development potential of each market segment, to help readers find the blue ocean market in different downstream markets.
Chapter 6: Sales of No Clean Flux in regional level and country level. It provides a quantitative analysis of the market size and development potential of each region and its main countries and introduces the market development, future development prospects, market space of each country in the world.
Chapter 7: Provides profiles of key players, introducing the basic situation of the main companies in the market in detail, including product sales, revenue, price, gross margin, product introduction, recent development, etc.
Chapter 8: Global No Clean Flux capacity by region & country.
Chapter 9: Introduces the market dynamics, latest developments of the market, the driving factors and restrictive factors of the market, the challenges and risks faced by manufacturers in the industry, and the analysis of relevant policies in the industry.
Chapter 10: Analysis of industrial chain, including the upstream and downstream of the industry.
Chapter 11: The main points and conclusions of the report.
TABLE OF CONTENTS
1 Introduction to Research & Analysis Reports
1.1 No Clean Flux Market Definition
1.2 Market Segments
1.2.1 Market by Type
1.2.2 Market by Application
1.3 Global No Clean Flux Market Overview
1.4 Features & Benefits of This Report
1.5 Methodology & Sources of Information
1.5.1 Research Methodology
1.5.2 Research Process
1.5.3 Base Year
1.5.4 Report Assumptions & Caveats
2 Global No Clean Flux Overall Market Size
2.1 Global No Clean Flux Market Size: 2023 VS 2030
2.2 Global No Clean Flux Revenue, Prospects & Forecasts: 2019-2030
2.3 Global No Clean Flux Sales: 2019-2030
3 Company Landscape
3.1 Top No Clean Flux Players in Global Market
3.2 Top Global No Clean Flux Companies Ranked by Revenue
3.3 Global No Clean Flux Revenue by Companies
3.4 Global No Clean Flux Sales by Companies
3.5 Global No Clean Flux Price by Manufacturer (2019-2024)
3.6 Top 3 and Top 5 No Clean Flux Companies in Global Market, by Revenue in 2023
3.7 Global Manufacturers No Clean Flux Product Type
3.8 Tier 1, Tier 2 and Tier 3 No Clean Flux Players in Global Market
3.8.1 List of Global Tier 1 No Clean Flux Companies
3.8.2 List of Global Tier 2 and Tier 3 No Clean Flux Companies
4 Sights by Product
4.1 Overview
4.1.1 By Type - Global No Clean Flux Market Size Markets, 2023 & 2030
4.1.2 VOC-free
4.1.3 Alcohol-based
4.2 By Type - Global No Clean Flux Revenue & Forecasts
4.2.1 By Type - Global No Clean Flux Revenue, 2019-2024
4.2.2 By Type - Global No Clean Flux Revenue, 2025-2030
4.2.3 By Type - Global No Clean Flux Revenue Market Share, 2019-2030
4.3 By Type - Global No Clean Flux Sales & Forecasts
4.3.1 By Type - Global No Clean Flux Sales, 2019-2024
4.3.2 By Type - Global No Clean Flux Sales, 2025-2030
4.3.3 By Type - Global No Clean Flux Sales Market Share, 2019-2030
4.4 By Type - Global No Clean Flux Price (Manufacturers Selling Prices), 2019-2030
5 Sights by Application
5.1 Overview
5.1.1 By Application - Global No Clean Flux Market Size, 2023 & 2030
5.1.2 Wave Soldering
5.1.3 Selective Soldering
5.1.4 Hand Soldering
5.2 By Application - Global No Clean Flux Revenue & Forecasts
5.2.1 By Application - Global No Clean Flux Revenue, 2019-2024
5.2.2 By Application - Global No Clean Flux Revenue, 2025-2030
5.2.3 By Application - Global No Clean Flux Revenue Market Share, 2019-2030
5.3 By Application - Global No Clean Flux Sales & Forecasts
5.3.1 By Application - Global No Clean Flux Sales, 2019-2024
5.3.2 By Application - Global No Clean Flux Sales, 2025-2030
5.3.3 By Application - Global No Clean Flux Sales Market Share, 2019-2030
5.4 By Application - Global No Clean Flux Price (Manufacturers Selling Prices), 2019-2030
6 Sights by Region
6.1 By Region - Global No Clean Flux Market Size, 2023 & 2030
6.2 By Region - Global No Clean Flux Revenue & Forecasts
6.2.1 By Region - Global No Clean Flux Revenue, 2019-2024
6.2.2 By Region - Global No Clean Flux Revenue, 2025-2030
6.2.3 By Region - Global No Clean Flux Revenue Market Share, 2019-2030
6.3 By Region - Global No Clean Flux Sales & Forecasts
6.3.1 By Region - Global No Clean Flux Sales, 2019-2024
6.3.2 By Region - Global No Clean Flux Sales, 2025-2030
6.3.3 By Region - Global No Clean Flux Sales Market Share, 2019-2030
6.4 North America
6.4.1 By Country - North America No Clean Flux Revenue, 2019-2030
6.4.2 By Country - North America No Clean Flux Sales, 2019-2030
6.4.3 US No Clean Flux Market Size, 2019-2030
6.4.4 Canada No Clean Flux Market Size, 2019-2030
6.4.5 Mexico No Clean Flux Market Size, 2019-2030
6.5 Europe
6.5.1 By Country - Europe No Clean Flux Revenue, 2019-2030
6.5.2 By Country - Europe No Clean Flux Sales, 2019-2030
6.5.3 Germany No Clean Flux Market Size, 2019-2030
6.5.4 France No Clean Flux Market Size, 2019-2030
6.5.5 U.K. No Clean Flux Market Size, 2019-2030
6.5.6 Italy No Clean Flux Market Size, 2019-2030
6.5.7 Russia No Clean Flux Market Size, 2019-2030
6.5.8 Nordic Countries No Clean Flux Market Size, 2019-2030
6.5.9 Benelux No Clean Flux Market Size, 2019-2030
6.6 Asia
6.6.1 By Region - Asia No Clean Flux Revenue, 2019-2030
6.6.2 By Region - Asia No Clean Flux Sales, 2019-2030
6.6.3 China No Clean Flux Market Size, 2019-2030
6.6.4 Japan No Clean Flux Market Size, 2019-2030
6.6.5 South Korea No Clean Flux Market Size, 2019-2030
6.6.6 Southeast Asia No Clean Flux Market Size, 2019-2030
6.6.7 India No Clean Flux Market Size, 2019-2030
6.7 South America
6.7.1 By Country - South America No Clean Flux Revenue, 2019-2030
6.7.2 By Country - South America No Clean Flux Sales, 2019-2030
6.7.3 Brazil No Clean Flux Market Size, 2019-2030
6.7.4 Argentina No Clean Flux Market Size, 2019-2030
6.8 Middle East & Africa
6.8.1 By Country - Middle East & Africa No Clean Flux Revenue, 2019-2030
6.8.2 By Country - Middle East & Africa No Clean Flux Sales, 2019-2030
6.8.3 Turkey No Clean Flux Market Size, 2019-2030
6.8.4 Israel No Clean Flux Market Size, 2019-2030
6.8.5 Saudi Arabia No Clean Flux Market Size, 2019-2030
6.8.6 UAE No Clean Flux Market Size, 2019-2030
7 Manufacturers & Brands Profiles
7.1 Senju
7.1.1 Senju Company Summary
7.1.2 Senju Business Overview
7.1.3 Senju No Clean Flux Major Product Offerings
7.1.4 Senju No Clean Flux Sales and Revenue in Global (2019-2024)
7.1.5 Senju Key News & Latest Developments
7.2 Alent (Alpha)
7.2.1 Alent (Alpha) Company Summary
7.2.2 Alent (Alpha) Business Overview
7.2.3 Alent (Alpha) No Clean Flux Major Product Offerings
7.2.4 Alent (Alpha) No Clean Flux Sales and Revenue in Global (2019-2024)
7.2.5 Alent (Alpha) Key News & Latest Developments
7.3 Tamura
7.3.1 Tamura Company Summary
7.3.2 Tamura Business Overview
7.3.3 Tamura No Clean Flux Major Product Offerings
7.3.4 Tamura No Clean Flux Sales and Revenue in Global (2019-2024)
7.3.5 Tamura Key News & Latest Developments
7.4 Henkel
7.4.1 Henkel Company Summary
7.4.2 Henkel Business Overview
7.4.3 Henkel No Clean Flux Major Product Offerings
7.4.4 Henkel No Clean Flux Sales and Revenue in Global (2019-2024)
7.4.5 Henkel Key News & Latest Developments
7.5 Indium
7.5.1 Indium Company Summary
7.5.2 Indium Business Overview
7.5.3 Indium No Clean Flux Major Product Offerings
7.5.4 Indium No Clean Flux Sales and Revenue in Global (2019-2024)
7.5.5 Indium Key News & Latest Developments
7.6 Kester
7.6.1 Kester Company Summary
7.6.2 Kester Business Overview
7.6.3 Kester No Clean Flux Major Product Offerings
7.6.4 Kester No Clean Flux Sales and Revenue in Global (2019-2024)
7.6.5 Kester Key News & Latest Developments
7.7 Shengmao
7.7.1 Shengmao Company Summary
7.7.2 Shengmao Business Overview
7.7.3 Shengmao No Clean Flux Major Product Offerings
7.7.4 Shengmao No Clean Flux Sales and Revenue in Global (2019-2024)
7.7.5 Shengmao Key News & Latest Developments
7.8 Inventec
7.8.1 Inventec Company Summary
7.8.2 Inventec Business Overview
7.8.3 Inventec No Clean Flux Major Product Offerings
7.8.4 Inventec No Clean Flux Sales and Revenue in Global (2019-2024)
7.8.5 Inventec Key News & Latest Developments
7.9 AIM Solder
7.9.1 AIM Solder Company Summary
7.9.2 AIM Solder Business Overview
7.9.3 AIM Solder No Clean Flux Major Product Offerings
7.9.4 AIM Solder No Clean Flux Sales and Revenue in Global (2019-2024)
7.9.5 AIM Solder Key News & Latest Developments
7.10 MG Chemicals
7.10.1 MG Chemicals Company Summary
7.10.2 MG Chemicals Business Overview
7.10.3 MG Chemicals No Clean Flux Major Product Offerings
7.10.4 MG Chemicals No Clean Flux Sales and Revenue in Global (2019-2024)
7.10.5 MG Chemicals Key News & Latest Developments
7.11 Chemtronics
7.11.1 Chemtronics Company Summary
7.11.2 Chemtronics No Clean Flux Business Overview
7.11.3 Chemtronics No Clean Flux Major Product Offerings
7.11.4 Chemtronics No Clean Flux Sales and Revenue in Global (2019-2024)
7.11.5 Chemtronics Key News & Latest Developments
8 Global No Clean Flux Production Capacity, Analysis
8.1 Global No Clean Flux Production Capacity, 2019-2030
8.2 No Clean Flux Production Capacity of Key Manufacturers in Global Market
8.3 Global No Clean Flux Production by Region
9 Key Market Trends, Opportunity, Drivers and Restraints
9.1 Market Opportunities & Trends
9.2 Market Drivers
9.3 Market Restraints
10 No Clean Flux Supply Chain Analysis
10.1 No Clean Flux Industry Value Chain
10.2 No Clean Flux Upstream Market
10.3 No Clean Flux Downstream and Clients
10.4 Marketing Channels Analysis
10.4.1 Marketing Channels
10.4.2 No Clean Flux Distributors and Sales Agents in Global
11 Conclusion
12 Appendix
12.1 Note
12.2 Examples of Clients
12.3 Disclaimer
LIST OF TABLES & FIGURES
List of Tables
Table 1. Key Players of No Clean Flux in Global Market
Table 2. Top No Clean Flux Players in Global Market, Ranking by Revenue (2023)
Table 3. Global No Clean Flux Revenue by Companies, (US$, Mn), 2019-2024
Table 4. Global No Clean Flux Revenue Share by Companies, 2019-2024
Table 5. Global No Clean Flux Sales by Companies, (Tons), 2019-2024
Table 6. Global No Clean Flux Sales Share by Companies, 2019-2024
Table 7. Key Manufacturers No Clean Flux Price (2019-2024) & (US$/Ton)
Table 8. Global Manufacturers No Clean Flux Product Type
Table 9. List of Global Tier 1 No Clean Flux Companies, Revenue (US$, Mn) in 2023 and Market Share
Table 10. List of Global Tier 2 and Tier 3 No Clean Flux Companies, Revenue (US$, Mn) in 2023 and Market Share
Table 11. By Type ? Global No Clean Flux Revenue, (US$, Mn), 2023 & 2030
Table 12. By Type - Global No Clean Flux Revenue (US$, Mn), 2019-2024
Table 13. By Type - Global No Clean Flux Revenue (US$, Mn), 2025-2030
Table 14. By Type - Global No Clean Flux Sales (Tons), 2019-2024
Table 15. By Type - Global No Clean Flux Sales (Tons), 2025-2030
Table 16. By Application ? Global No Clean Flux Revenue, (US$, Mn), 2023 & 2030
Table 17. By Application - Global No Clean Flux Revenue (US$, Mn), 2019-2024
Table 18. By Application - Global No Clean Flux Revenue (US$, Mn), 2025-2030
Table 19. By Application - Global No Clean Flux Sales (Tons), 2019-2024
Table 20. By Application - Global No Clean Flux Sales (Tons), 2025-2030
Table 21. By Region ? Global No Clean Flux Revenue, (US$, Mn), 2023 VS 2030
Table 22. By Region - Global No Clean Flux Revenue (US$, Mn), 2019-2024
Table 23. By Region - Global No Clean Flux Revenue (US$, Mn), 2025-2030
Table 24. By Region - Global No Clean Flux Sales (Tons), 2019-2024
Table 25. By Region - Global No Clean Flux Sales (Tons), 2025-2030
Table 26. By Country - North America No Clean Flux Revenue, (US$, Mn), 2019-2024
Table 27. By Country - North America No Clean Flux Revenue, (US$, Mn), 2025-2030
Table 28. By Country - North America No Clean Flux Sales, (Tons), 2019-2024
Table 29. By Country - North America No Clean Flux Sales, (Tons), 2025-2030
Table 30. By Country - Europe No Clean Flux Revenue, (US$, Mn), 2019-2024
Table 31. By Country - Europe No Clean Flux Revenue, (US$, Mn), 2025-2030
Table 32. By Country - Europe No Clean Flux Sales, (Tons), 2019-2024
Table 33. By Country - Europe No Clean Flux Sales, (Tons), 2025-2030
Table 34. By Region - Asia No Clean Flux Revenue, (US$, Mn), 2019-2024
Table 35. By Region - Asia No Clean Flux Revenue, (US$, Mn), 2025-2030
Table 36. By Region - Asia No Clean Flux Sales, (Tons), 2019-2024
Table 37. By Region - Asia No Clean Flux Sales, (Tons), 2025-2030
Table 38. By Country - South America No Clean Flux Revenue, (US$, Mn), 2019-2024
Table 39. By Country - South America No Clean Flux Revenue, (US$, Mn), 2025-2030
Table 40. By Country - South America No Clean Flux Sales, (Tons), 2019-2024
Table 41. By Country - South America No Clean Flux Sales, (Tons), 2025-2030
Table 42. By Country - Middle East & Africa No Clean Flux Revenue, (US$, Mn), 2019-2024
Table 43. By Country - Middle East & Africa No Clean Flux Revenue, (US$, Mn), 2025-2030
Table 44. By Country - Middle East & Africa No Clean Flux Sales, (Tons), 2019-2024
Table 45. By Country - Middle East & Africa No Clean Flux Sales, (Tons), 2025-2030
Table 46. Senju Company Summary
Table 47. Senju No Clean Flux Product Offerings
Table 48. Senju No Clean Flux Sales (Tons), Revenue (US$, Mn) and Average Price (US$/Ton) (2019-2024)
Table 49. Senju Key News & Latest Developments
Table 50. Alent (Alpha) Company Summary
Table 51. Alent (Alpha) No Clean Flux Product Offerings
Table 52. Alent (Alpha) No Clean Flux Sales (Tons), Revenue (US$, Mn) and Average Price (US$/Ton) (2019-2024)
Table 53. Alent (Alpha) Key News & Latest Developments
Table 54. Tamura Company Summary
Table 55. Tamura No Clean Flux Product Offerings
Table 56. Tamura No Clean Flux Sales (Tons), Revenue (US$, Mn) and Average Price (US$/Ton) (2019-2024)
Table 57. Tamura Key News & Latest Developments
Table 58. Henkel Company Summary
Table 59. Henkel No Clean Flux Product Offerings
Table 60. Henkel No Clean Flux Sales (Tons), Revenue (US$, Mn) and Average Price (US$/Ton) (2019-2024)
Table 61. Henkel Key News & Latest Developments
Table 62. Indium Company Summary
Table 63. Indium No Clean Flux Product Offerings
Table 64. Indium No Clean Flux Sales (Tons), Revenue (US$, Mn) and Average Price (US$/Ton) (2019-2024)
Table 65. Indium Key News & Latest Developments
Table 66. Kester Company Summary
Table 67. Kester No Clean Flux Product Offerings
Table 68. Kester No Clean Flux Sales (Tons), Revenue (US$, Mn) and Average Price (US$/Ton) (2019-2024)
Table 69. Kester Key News & Latest Developments
Table 70. Shengmao Company Summary
Table 71. Shengmao No Clean Flux Product Offerings
Table 72. Shengmao No Clean Flux Sales (Tons), Revenue (US$, Mn) and Average Price (US$/Ton) (2019-2024)
Table 73. Shengmao Key News & Latest Developments
Table 74. Inventec Company Summary
Table 75. Inventec No Clean Flux Product Offerings
Table 76. Inventec No Clean Flux Sales (Tons), Revenue (US$, Mn) and Average Price (US$/Ton) (2019-2024)
Table 77. Inventec Key News & Latest Developments
Table 78. AIM Solder Company Summary
Table 79. AIM Solder No Clean Flux Product Offerings
Table 80. AIM Solder No Clean Flux Sales (Tons), Revenue (US$, Mn) and Average Price (US$/Ton) (2019-2024)
Table 81. AIM Solder Key News & Latest Developments
Table 82. MG Chemicals Company Summary
Table 83. MG Chemicals No Clean Flux Product Offerings
Table 84. MG Chemicals No Clean Flux Sales (Tons), Revenue (US$, Mn) and Average Price (US$/Ton) (2019-2024)
Table 85. MG Chemicals Key News & Latest Developments
Table 86. Chemtronics Company Summary
Table 87. Chemtronics No Clean Flux Product Offerings
Table 88. Chemtronics No Clean Flux Sales (Tons), Revenue (US$, Mn) and Average Price (US$/Ton) (2019-2024)
Table 89. Chemtronics Key News & Latest Developments
Table 90. No Clean Flux Production Capacity (Tons) of Key Manufacturers in Global Market, 2022-2024 (Tons)
Table 91. Global No Clean Flux Capacity Market Share of Key Manufacturers, 2022-2024
Table 92. Global No Clean Flux Production by Region, 2019-2024 (Tons)
Table 93. Global No Clean Flux Production by Region, 2025-2030 (Tons)
Table 94. No Clean Flux Market Opportunities & Trends in Global Market
Table 95. No Clean Flux Market Drivers in Global Market
Table 96. No Clean Flux Market Restraints in Global Market
Table 97. No Clean Flux Raw Materials
Table 98. No Clean Flux Raw Materials Suppliers in Global Market
Table 99. Typical No Clean Flux Downstream
Table 100. No Clean Flux Downstream Clients in Global Market
Table 101. No Clean Flux Distributors and Sales Agents in Global Market
List of Figures
Figure 1. No Clean Flux Segment by Type in 2023
Figure 2. No Clean Flux Segment by Application in 2023
Figure 3. Global No Clean Flux Market Overview: 2023
Figure 4. Key Caveats
Figure 5. Global No Clean Flux Market Size: 2023 VS 2030 (US$, Mn)
Figure 6. Global No Clean Flux Revenue, 2019-2030 (US$, Mn)
Figure 7. No Clean Flux Sales in Global Market: 2019-2030 (Tons)
Figure 8. The Top 3 and 5 Players Market Share by No Clean Flux Revenue in 2023
Figure 9. By Type - Global No Clean Flux Revenue, (US$, Mn), 2023 & 2030
Figure 10. By Type - Global No Clean Flux Revenue Market Share, 2019-2030
Figure 11. By Type - Global No Clean Flux Sales Market Share, 2019-2030
Figure 12. By Type - Global No Clean Flux Price (US$/Ton), 2019-2030
Figure 13. By Application - Global No Clean Flux Revenue, (US$, Mn), 2023 & 2030
Figure 14. By Application - Global No Clean Flux Revenue Market Share, 2019-2030
Figure 15. By Application - Global No Clean Flux Sales Market Share, 2019-2030
Figure 16. By Application - Global No Clean Flux Price (US$/Ton), 2019-2030
Figure 17. By Region - Global No Clean Flux Revenue, (US$, Mn), 2023 & 2030
Figure 18. By Region - Global No Clean Flux Revenue Market Share, 2019 VS 2023 VS 2030
Figure 19. By Region - Global No Clean Flux Revenue Market Share, 2019-2030
Figure 20. By Region - Global No Clean Flux Sales Market Share, 2019-2030
Figure 21. By Country - North America No Clean Flux Revenue Market Share, 2019-2030
Figure 22. By Country - North America No Clean Flux Sales Market Share, 2019-2030
Figure 23. US No Clean Flux Revenue, (US$, Mn), 2019-2030
Figure 24. Canada No Clean Flux Revenue, (US$, Mn), 2019-2030
Figure 25. Mexico No Clean Flux Revenue, (US$, Mn), 2019-2030
Figure 26. By Country - Europe No Clean Flux Revenue Market Share, 2019-2030
Figure 27. By Country - Europe No Clean Flux Sales Market Share, 2019-2030
Figure 28. Germany No Clean Flux Revenue, (US$, Mn), 2019-2030
Figure 29. France No Clean Flux Revenue, (US$, Mn), 2019-2030
Figure 30. U.K. No Clean Flux Revenue, (US$, Mn), 2019-2030
Figure 31. Italy No Clean Flux Revenue, (US$, Mn), 2019-2030
Figure 32. Russia No Clean Flux Revenue, (US$, Mn), 2019-2030
Figure 33. Nordic Countries No Clean Flux Revenue, (US$, Mn), 2019-2030
Figure 34. Benelux No Clean Flux Revenue, (US$, Mn), 2019-2030
Figure 35. By Region - Asia No Clean Flux Revenue Market Share, 2019-2030
Figure 36. By Region - Asia No Clean Flux Sales Market Share, 2019-2030
Figure 37. China No Clean Flux Revenue, (US$, Mn), 2019-2030
Figure 38. Japan No Clean Flux Revenue, (US$, Mn), 2019-2030
Figure 39. South Korea No Clean Flux Revenue, (US$, Mn), 2019-2030
Figure 40. Southeast Asia No Clean Flux Revenue, (US$, Mn), 2019-2030
Figure 41. India No Clean Flux Revenue, (US$, Mn), 2019-2030
Figure 42. By Country - South America No Clean Flux Revenue Market Share, 2019-2030
Figure 43. By Country - South America No Clean Flux Sales Market Share, 2019-2030
Figure 44. Brazil No Clean Flux Revenue, (US$, Mn), 2019-2030
Figure 45. Argentina No Clean Flux Revenue, (US$, Mn), 2019-2030
Figure 46. By Country - Middle East & Africa No Clean Flux Revenue Market Share, 2019-2030
Figure 47. By Country - Middle East & Africa No Clean Flux Sales Market Share, 2019-2030
Figure 48. Turkey No Clean Flux Revenue, (US$, Mn), 2019-2030
Figure 49. Israel No Clean Flux Revenue, (US$, Mn), 2019-2030
Figure 50. Saudi Arabia No Clean Flux Revenue, (US$, Mn), 2019-2030
Figure 51. UAE No Clean Flux Revenue, (US$, Mn), 2019-2030
Figure 52. Global No Clean Flux Production Capacity (Tons), 2019-2030
Figure 53. The Percentage of Production No Clean Flux by Region, 2023 VS 2030
Figure 54. No Clean Flux Industry Value Chain
Figure 55. Marketing Channels

