Hydrolysed plant protein (HPP) is a product derived from the hydrolysis of plant-based protein sources such as cereals and legumes. The process involves boiling these raw materials in hydrochloric acid and subsequently neutralizing them with sodium hydroxide. The end product is a protein-rich solution that is commonly used as a flavor enhancer in various food products, including sauces, soup bases, and marinades. HPP is widely recognized for its ability to enhance umami flavors, making it a popular ingredient in the food and beverage industry.
Market Size
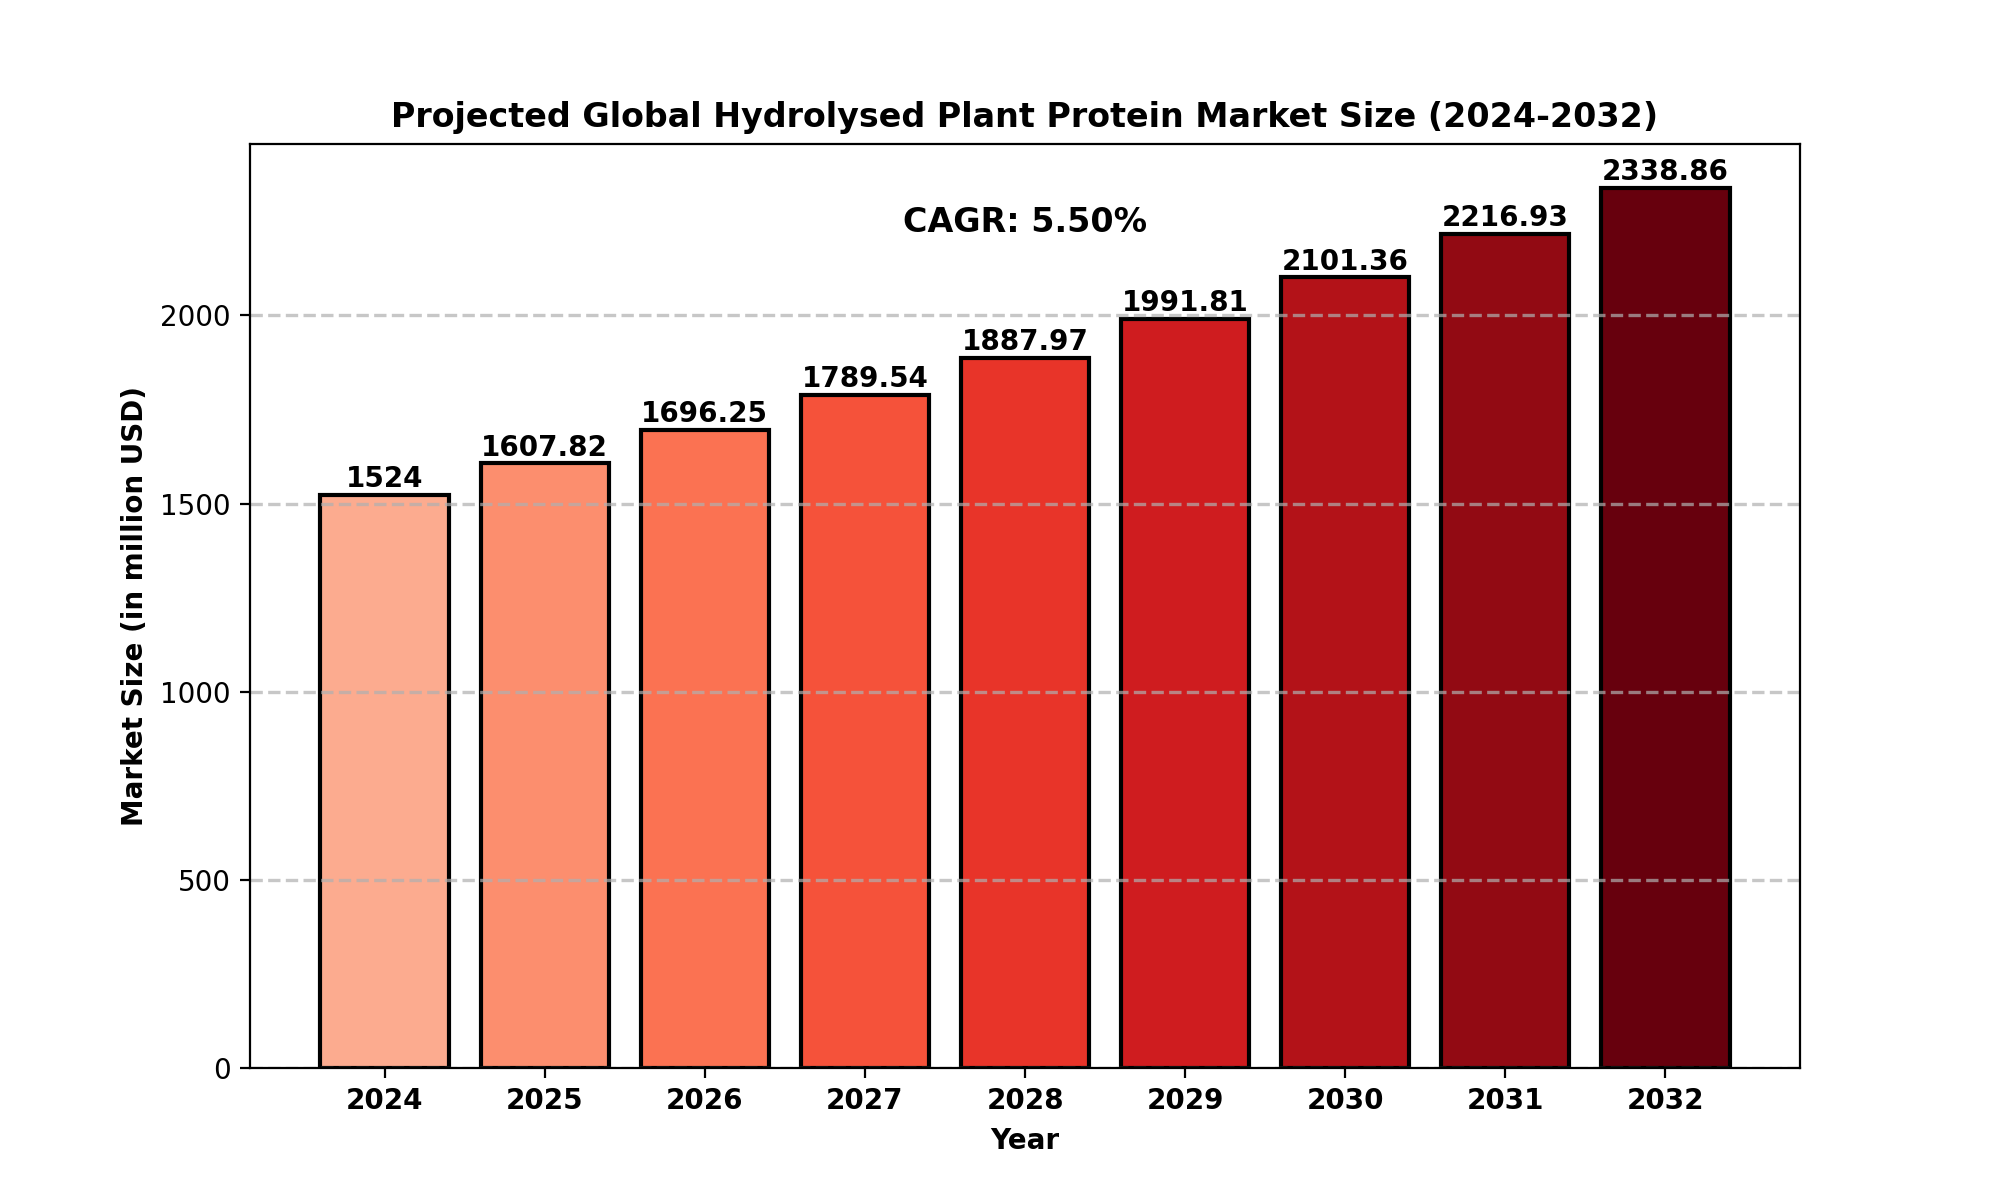
The global Hydrolysed Plant Protein market was valued at approximately USD 1,524 million in 2024 and is expected to grow to USD 2,338.86 million by 2032, exhibiting a CAGR of 5.50% during the forecast period.
The North American Hydrolysed Plant Protein market was estimated at USD 435.44 million in 2024, with a projected CAGR of 4.71% between 2025 and 2032.
The increasing consumer demand for plant-based and functional food ingredients has significantly contributed to this market growth.
Market Dynamics (Drivers, Restraints, Opportunities, and Challenges)
Drivers
-
Growing Demand for Plant-Based Protein: With a rise in vegetarianism and veganism, the demand for alternative protein sources has surged, driving the growth of the HPP market.
-
Increased Application in Processed Foods: HPP is widely used in processed and convenience foods due to its flavor-enhancing properties.
-
Rising Health Awareness: Consumers are opting for clean-label and non-GMO ingredients, leading to increased adoption of hydrolysed plant protein.
-
Growth in Functional Foods and Nutraceuticals: The application of HPP in dietary supplements and functional foods is expanding due to its high bioavailability and easy digestibility.
Restraints
-
Stringent Food Regulations: Various countries have strict regulations regarding food additives, which may restrict the market growth of HPP.
-
High Production Costs: The production of HPP requires advanced processing techniques, making it costlier than other plant-based protein alternatives.
Opportunities
-
Expansion in Emerging Markets: The growing food processing industry in regions like Asia-Pacific presents an opportunity for market expansion.
-
Technological Innovations: Advancements in protein extraction and hydrolysis techniques may lead to improved product efficiency and cost reduction.
Challenges
-
Supply Chain Disruptions: Fluctuations in raw material availability can impact the production and pricing of HPP.
-
Competition from Other Plant Proteins: Alternative plant-based proteins such as pea and rice protein may pose a challenge to market penetration.
Regional Analysis
North America
The North American market holds a significant share due to high consumer awareness and a well-established food and beverage industry. The region's growth is driven by the increasing demand for natural and plant-based ingredients.
Europe
Europe is witnessing robust growth in the HPP market due to stringent food safety regulations and a strong preference for organic and non-GMO ingredients. Countries like Germany, the UK, and France are key contributors.
Asia-Pacific
This region is experiencing the fastest growth, mainly due to the rising adoption of plant-based diets, increasing urbanization, and the growing food processing industry in China, Japan, and India.
South America
The market in South America is growing at a steady pace, with Brazil and Argentina being the leading markets for hydrolysed plant protein, particularly in the processed food sector.
Middle East & Africa
While still an emerging market, the increasing demand for processed and convenience foods in the Middle East and Africa is expected to drive HPP market growth in the coming years.
Competitor Analysis
The Hydrolysed Plant Protein market is highly competitive, with several key players operating globally. Some of the major companies include:
These companies are investing in R&D, product innovations, and strategic partnerships to maintain their market position.
Market Segmentation (by Application)
-
Sauce
-
Soup Bases
-
Marinade
-
Other
Market Segmentation (by Type)
Geographic Segmentation
-
North America (USA, Canada, Mexico)
-
Europe (Germany, UK, France, Russia, Italy, Rest of Europe)
-
Asia-Pacific (China, Japan, South Korea, India, Southeast Asia, Rest of Asia-Pacific)
-
South America (Brazil, Argentina, Colombia, Rest of South America)
-
Middle East and Africa (Saudi Arabia, UAE, Egypt, Nigeria, South Africa, Rest of MEA)
FAQ Section
What is the current market size of the Hydrolysed Plant Protein market?
- The global market size was estimated at USD 1,524 million in 2024 and is projected to reach USD 2,467.50 million by 2032, growing at a CAGR of 5.50%.
Which are the key companies operating in the Hydrolysed Plant Protein market?
- Some of the key players include Tate & Lyle, Archer Daniels Midland, Exter, Griffith Foods, Sensient Technologies, Kerry, and Cargill.
What are the key growth drivers in the Hydrolysed Plant Protein market?
- Key drivers include increasing demand for plant-based proteins, the growing popularity of processed and convenience foods, and rising health consciousness among consumers.
Which regions dominate the Hydrolysed Plant Protein market?
- North America and Europe currently hold significant market shares, while Asia-Pacific is the fastest-growing region due to increased consumer awareness and urbanization.
What are the emerging trends in the Hydrolysed Plant Protein market?
- Trends include clean-label formulations, non-GMO products, expansion into new applications such as nutraceuticals, and advancements in protein extraction technologies.
Key Benefits of This Market Research:
-
Industry drivers, restraints, and opportunities covered in the study
-
Neutral perspective on the market performance
-
Recent industry trends and developments
-
Competitive landscape & strategies of key players
-
Potential & niche segments and regions exhibiting promising growth covered
-
Historical, current, and projected market size, in terms of value
-
In-depth analysis of the Hydrolysed Plant Protein Market
-
Overview of the regional outlook of the Hydrolysed Plant Protein Market:
Key Reasons to Buy this Report:
-
Access to date statistics compiled by our researchers. These provide you with historical and forecast data, which is analyzed to tell you why your market is set to change
-
This enables you to anticipate market changes to remain ahead of your competitors
-
You will be able to copy data from the Excel spreadsheet straight into your marketing plans, business presentations, or other strategic documents
-
The concise analysis, clear graph, and table format will enable you to pinpoint the information you require quickly
-
Provision of market value data for each segment and sub-segment
-
Indicates the region and segment that is expected to witness the fastest growth as well as to dominate the market
-
Analysis by geography highlighting the consumption of the product/service in the region as well as indicating the factors that are affecting the market within each region
-
Competitive landscape which incorporates the market ranking of the major players, along with new service/product launches, partnerships, business expansions, and acquisitions in the past five years of companies profiled
-
Extensive company profiles comprising of company overview, company insights, product benchmarking, and SWOT analysis for the major market players
-
The current as well as the future market outlook of the industry concerning recent developments which involve growth opportunities and drivers as well as challenges and restraints of both emerging as well as developed regions
-
Includes in-depth analysis of the market from various perspectives through Porters five forces analysis
-
Provides insight into the market through Value Chain
-
Market dynamics scenario, along with growth opportunities of the market in the years to come
-
6-month post-sales analyst support
Customization of the Report
Chapter Outline
-
Chapter 1 mainly introduces the statistical scope of the report, market division standards, and market research methods.
-
Chapter 2 is an executive summary of different market segments (by region, product type, application, etc), including the market size of each market segment, future development potential, and so on. It offers a high-level view of the current state of the Hydrolysed Plant Protein Market and its likely evolution in the short to mid-term, and long term.
-
Chapter 3 makes a detailed analysis of the market's competitive landscape of the market and provides the market share, capacity, output, price, latest development plan, merger, and acquisition information of the main manufacturers in the market.
-
Chapter 4 is the analysis of the whole market industrial chain, including the upstream and downstream of the industry, as well as Porter's five forces analysis.
-
Chapter 5 introduces the latest developments of the market, the driving factors and restrictive factors of the market, the challenges and risks faced by manufacturers in the industry, and the analysis of relevant policies in the industry.
-
Chapter 6 provides the analysis of various market segments according to product types, covering the market size and development potential of each market segment, to help readers find the blue ocean market in different market segments.
-
Chapter 7 provides the analysis of various market segments according to application, covering the market size and development potential of each market segment, to help readers find the blue ocean market in different downstream markets.
-
Chapter 8 provides a quantitative analysis of the market size and development potential of each region from the consumer side and its main countries and introduces the market development, future development prospects, market space, and capacity of each country in the world.
-
Chapter 9 shares the main producing countries of Hydrolysed Plant Protein, their output value, profit level, regional supply, production capacity layout, etc. from the supply side.
-
Chapter 10 introduces the basic situation of the main companies in the market in detail, including product sales revenue, sales volume, price, gross profit margin, market share, product introduction, recent development, etc.
-
Chapter 11 provides a quantitative analysis of the market size and development potential of each region during the forecast period.
-
Chapter 12 provides a quantitative analysis of the market size and development potential of each market segment during the forecast period.
-
Chapter 13 is the main points and conclusions of the report.
TABLE OF CONTENTS
Table of Contents
1 Research Methodology and Statistical Scope
1.1 Market Definition and Statistical Scope of Hydrolysed Plant Protein
1.2 Key Market Segments
1.2.1 Hydrolysed Plant Protein Segment by Type
1.2.2 Hydrolysed Plant Protein Segment by Application
1.3 Methodology & Sources of Information
1.3.1 Research Methodology
1.3.2 Research Process
1.3.3 Market Breakdown and Data Triangulation
1.3.4 Base Year
1.3.5 Report Assumptions & Caveats
2 Hydrolysed Plant Protein Market Overview
2.1 Global Market Overview
2.1.1 Global Hydrolysed Plant Protein Market Size (M USD) Estimates and Forecasts (2019-2032)
2.1.2 Global Hydrolysed Plant Protein Sales Estimates and Forecasts (2019-2032)
2.2 Market Segment Executive Summary
2.3 Global Market Size by Region
3 Hydrolysed Plant Protein Market Competitive Landscape
3.1 Global Hydrolysed Plant Protein Sales by Manufacturers (2019-2025)
3.2 Global Hydrolysed Plant Protein Revenue Market Share by Manufacturers (2019-2025)
3.3 Hydrolysed Plant Protein Market Share by Company Type (Tier 1, Tier 2, and Tier 3)
3.4 Global Hydrolysed Plant Protein Average Price by Manufacturers (2019-2025)
3.5 Manufacturers Hydrolysed Plant Protein Sales Sites, Area Served, Product Type
3.6 Hydrolysed Plant Protein Market Competitive Situation and Trends
3.6.1 Hydrolysed Plant Protein Market Concentration Rate
3.6.2 Global 5 and 10 Largest Hydrolysed Plant Protein Players Market Share by Revenue
3.6.3 Mergers & Acquisitions, Expansion
4 Hydrolysed Plant Protein Industry Chain Analysis
4.1 Hydrolysed Plant Protein Industry Chain Analysis
4.2 Market Overview of Key Raw Materials
4.3 Midstream Market Analysis
4.4 Downstream Customer Analysis
5 The Development and Dynamics of Hydrolysed Plant Protein Market
5.1 Key Development Trends
5.2 Driving Factors
5.3 Market Challenges
5.4 Market Restraints
5.5 Industry News
5.5.1 New Product Developments
5.5.2 Mergers & Acquisitions
5.5.3 Expansions
5.5.4 Collaboration/Supply Contracts
5.6 Industry Policies
6 Hydrolysed Plant Protein Market Segmentation by Type
6.1 Evaluation Matrix of Segment Market Development Potential (Type)
6.2 Global Hydrolysed Plant Protein Sales Market Share by Type (2019-2025)
6.3 Global Hydrolysed Plant Protein Market Size Market Share by Type (2019-2025)
6.4 Global Hydrolysed Plant Protein Price by Type (2019-2025)
7 Hydrolysed Plant Protein Market Segmentation by Application
7.1 Evaluation Matrix of Segment Market Development Potential (Application)
7.2 Global Hydrolysed Plant Protein Market Sales by Application (2019-2025)
7.3 Global Hydrolysed Plant Protein Market Size (M USD) by Application (2019-2025)
7.4 Global Hydrolysed Plant Protein Sales Growth Rate by Application (2019-2025)
8 Hydrolysed Plant Protein Market Consumption by Region
8.1 Global Hydrolysed Plant Protein Sales by Region
8.1.1 Global Hydrolysed Plant Protein Sales by Region
8.1.2 Global Hydrolysed Plant Protein Sales Market Share by Region
8.2 North America
8.2.1 North America Hydrolysed Plant Protein Sales by Country
8.2.2 U.S.
8.2.3 Canada
8.2.4 Mexico
8.3 Europe
8.3.1 Europe Hydrolysed Plant Protein Sales by Country
8.3.2 Germany
8.3.3 France
8.3.4 U.K.
8.3.5 Italy
8.3.6 Russia
8.4 Asia Pacific
8.4.1 Asia Pacific Hydrolysed Plant Protein Sales by Region
8.4.2 China
8.4.3 Japan
8.4.4 South Korea
8.4.5 India
8.4.6 Southeast Asia
8.5 South America
8.5.1 South America Hydrolysed Plant Protein Sales by Country
8.5.2 Brazil
8.5.3 Argentina
8.5.4 Columbia
8.6 Middle East and Africa
8.6.1 Middle East and Africa Hydrolysed Plant Protein Sales by Region
8.6.2 Saudi Arabia
8.6.3 UAE
8.6.4 Egypt
8.6.5 Nigeria
8.6.6 South Africa
9 Hydrolysed Plant Protein Market Production by Region
9.1 Global Production of Hydrolysed Plant Protein by Region (2019-2025)
9.2 Global Hydrolysed Plant Protein Revenue Market Share by Region (2019-2025)
9.3 Global Hydrolysed Plant Protein Production, Revenue, Price and Gross Margin (2019-2025)
9.4 North America Hydrolysed Plant Protein Production
9.4.1 North America Hydrolysed Plant Protein Production Growth Rate (2019-2025)
9.4.2 North America Hydrolysed Plant Protein Production, Revenue, Price and Gross Margin (2019-2025)
9.5 Europe Hydrolysed Plant Protein Production
9.5.1 Europe Hydrolysed Plant Protein Production Growth Rate (2019-2025)
9.5.2 Europe Hydrolysed Plant Protein Production, Revenue, Price and Gross Margin (2019-2025)
9.6 Japan Hydrolysed Plant Protein Production (2019-2025)
9.6.1 Japan Hydrolysed Plant Protein Production Growth Rate (2019-2025)
9.6.2 Japan Hydrolysed Plant Protein Production, Revenue, Price and Gross Margin (2019-2025)
9.7 China Hydrolysed Plant Protein Production (2019-2025)
9.7.1 China Hydrolysed Plant Protein Production Growth Rate (2019-2025)
9.7.2 China Hydrolysed Plant Protein Production, Revenue, Price and Gross Margin (2019-2025)
10 Key Companies Profile
10.1 Tate and Lyle
10.1.1 Tate and Lyle Hydrolysed Plant Protein Basic Information
10.1.2 Tate and Lyle Hydrolysed Plant Protein Product Overview
10.1.3 Tate and Lyle Hydrolysed Plant Protein Product Market Performance
10.1.4 Tate and Lyle Business Overview
10.1.5 Tate and Lyle Hydrolysed Plant Protein SWOT Analysis
10.1.6 Tate and Lyle Recent Developments
10.2 Archer Daniels Midland
10.2.1 Archer Daniels Midland Hydrolysed Plant Protein Basic Information
10.2.2 Archer Daniels Midland Hydrolysed Plant Protein Product Overview
10.2.3 Archer Daniels Midland Hydrolysed Plant Protein Product Market Performance
10.2.4 Archer Daniels Midland Business Overview
10.2.5 Archer Daniels Midland Hydrolysed Plant Protein SWOT Analysis
10.2.6 Archer Daniels Midland Recent Developments
10.3 Exter
10.3.1 Exter Hydrolysed Plant Protein Basic Information
10.3.2 Exter Hydrolysed Plant Protein Product Overview
10.3.3 Exter Hydrolysed Plant Protein Product Market Performance
10.3.4 Exter Hydrolysed Plant Protein SWOT Analysis
10.3.5 Exter Business Overview
10.3.6 Exter Recent Developments
10.4 Griffith Foods
10.4.1 Griffith Foods Hydrolysed Plant Protein Basic Information
10.4.2 Griffith Foods Hydrolysed Plant Protein Product Overview
10.4.3 Griffith Foods Hydrolysed Plant Protein Product Market Performance
10.4.4 Griffith Foods Business Overview
10.4.5 Griffith Foods Recent Developments
10.5 Sensient Technologies
10.5.1 Sensient Technologies Hydrolysed Plant Protein Basic Information
10.5.2 Sensient Technologies Hydrolysed Plant Protein Product Overview
10.5.3 Sensient Technologies Hydrolysed Plant Protein Product Market Performance
10.5.4 Sensient Technologies Business Overview
10.5.5 Sensient Technologies Recent Developments
10.6 Vitana
10.6.1 Vitana Hydrolysed Plant Protein Basic Information
10.6.2 Vitana Hydrolysed Plant Protein Product Overview
10.6.3 Vitana Hydrolysed Plant Protein Product Market Performance
10.6.4 Vitana Business Overview
10.6.5 Vitana Recent Developments
10.7 Kerry
10.7.1 Kerry Hydrolysed Plant Protein Basic Information
10.7.2 Kerry Hydrolysed Plant Protein Product Overview
10.7.3 Kerry Hydrolysed Plant Protein Product Market Performance
10.7.4 Kerry Business Overview
10.7.5 Kerry Recent Developments
10.8 Aipu
10.8.1 Aipu Hydrolysed Plant Protein Basic Information
10.8.2 Aipu Hydrolysed Plant Protein Product Overview
10.8.3 Aipu Hydrolysed Plant Protein Product Market Performance
10.8.4 Aipu Business Overview
10.8.5 Aipu Recent Developments
10.9 Cargill
10.9.1 Cargill Hydrolysed Plant Protein Basic Information
10.9.2 Cargill Hydrolysed Plant Protein Product Overview
10.9.3 Cargill Hydrolysed Plant Protein Product Market Performance
10.9.4 Cargill Business Overview
10.9.5 Cargill Recent Developments
10.10 Basic Food Flavors
10.10.1 Basic Food Flavors Hydrolysed Plant Protein Basic Information
10.10.2 Basic Food Flavors Hydrolysed Plant Protein Product Overview
10.10.3 Basic Food Flavors Hydrolysed Plant Protein Product Market Performance
10.10.4 Basic Food Flavors Business Overview
10.10.5 Basic Food Flavors Recent Developments
10.11 San Soon Seng Food Industries
10.11.1 San Soon Seng Food Industries Hydrolysed Plant Protein Basic Information
10.11.2 San Soon Seng Food Industries Hydrolysed Plant Protein Product Overview
10.11.3 San Soon Seng Food Industries Hydrolysed Plant Protein Product Market Performance
10.11.4 San Soon Seng Food Industries Business Overview
10.11.5 San Soon Seng Food Industries Recent Developments
10.12 Ajinomoto
10.12.1 Ajinomoto Hydrolysed Plant Protein Basic Information
10.12.2 Ajinomoto Hydrolysed Plant Protein Product Overview
10.12.3 Ajinomoto Hydrolysed Plant Protein Product Market Performance
10.12.4 Ajinomoto Business Overview
10.12.5 Ajinomoto Recent Developments
11 Hydrolysed Plant Protein Market Forecast by Region
11.1 Global Hydrolysed Plant Protein Market Size Forecast
11.2 Global Hydrolysed Plant Protein Market Forecast by Region
11.2.1 North America Market Size Forecast by Country
11.2.2 Europe Hydrolysed Plant Protein Market Size Forecast by Country
11.2.3 Asia Pacific Hydrolysed Plant Protein Market Size Forecast by Region
11.2.4 South America Hydrolysed Plant Protein Market Size Forecast by Country
11.2.5 Middle East and Africa Forecasted Consumption of Hydrolysed Plant Protein by Country
12 Forecast Market by Type and by Application (2025-2032)
12.1 Global Hydrolysed Plant Protein Market Forecast by Type (2025-2032)
12.1.1 Global Forecasted Sales of Hydrolysed Plant Protein by Type (2025-2032)
12.1.2 Global Hydrolysed Plant Protein Market Size Forecast by Type (2025-2032)
12.1.3 Global Forecasted Price of Hydrolysed Plant Protein by Type (2025-2032)
12.2 Global Hydrolysed Plant Protein Market Forecast by Application (2025-2032)
12.2.1 Global Hydrolysed Plant Protein Sales (K MT) Forecast by Application
12.2.2 Global Hydrolysed Plant Protein Market Size (M USD) Forecast by Application (2025-2032)
13 Conclusion and Key Findings
LIST OF TABLES & FIGURES
List of Tables
Table 1. Introduction of the Type
Table 2. Introduction of the Application
Table 3. Market Size (M USD) Segment Executive Summary
Table 4. Hydrolysed Plant Protein Market Size Comparison by Region (M USD)
Table 5. Global Hydrolysed Plant Protein Sales (K MT) by Manufacturers (2019-2025)
Table 6. Global Hydrolysed Plant Protein Sales Market Share by Manufacturers (2019-2025)
Table 7. Global Hydrolysed Plant Protein Revenue (M USD) by Manufacturers (2019-2025)
Table 8. Global Hydrolysed Plant Protein Revenue Share by Manufacturers (2019-2025)
Table 9. Company Type (Tier 1, Tier 2, and Tier 3) & (based on the Revenue in Hydrolysed Plant Protein as of 2022)
Table 10. Global Market Hydrolysed Plant Protein Average Price (USD/MT) of Key Manufacturers (2019-2025)
Table 11. Manufacturers Hydrolysed Plant Protein Sales Sites and Area Served
Table 12. Manufacturers Hydrolysed Plant Protein Product Type
Table 13. Global Hydrolysed Plant Protein Manufacturers Market Concentration Ratio (CR5 and HHI)
Table 14. Mergers & Acquisitions, Expansion Plans
Table 15. Industry Chain Map of Hydrolysed Plant Protein
Table 16. Market Overview of Key Raw Materials
Table 17. Midstream Market Analysis
Table 18. Downstream Customer Analysis
Table 19. Key Development Trends
Table 20. Driving Factors
Table 21. Hydrolysed Plant Protein Market Challenges
Table 22. Global Hydrolysed Plant Protein Sales by Type (K MT)
Table 23. Global Hydrolysed Plant Protein Market Size by Type (M USD)
Table 24. Global Hydrolysed Plant Protein Sales (K MT) by Type (2019-2025)
Table 25. Global Hydrolysed Plant Protein Sales Market Share by Type (2019-2025)
Table 26. Global Hydrolysed Plant Protein Market Size (M USD) by Type (2019-2025)
Table 27. Global Hydrolysed Plant Protein Market Size Share by Type (2019-2025)
Table 28. Global Hydrolysed Plant Protein Price (USD/MT) by Type (2019-2025)
Table 29. Global Hydrolysed Plant Protein Sales (K MT) by Application
Table 30. Global Hydrolysed Plant Protein Market Size by Application
Table 31. Global Hydrolysed Plant Protein Sales by Application (2019-2025) & (K MT)
Table 32. Global Hydrolysed Plant Protein Sales Market Share by Application (2019-2025)
Table 33. Global Hydrolysed Plant Protein Sales by Application (2019-2025) & (M USD)
Table 34. Global Hydrolysed Plant Protein Market Share by Application (2019-2025)
Table 35. Global Hydrolysed Plant Protein Sales Growth Rate by Application (2019-2025)
Table 36. Global Hydrolysed Plant Protein Sales by Region (2019-2025) & (K MT)
Table 37. Global Hydrolysed Plant Protein Sales Market Share by Region (2019-2025)
Table 38. North America Hydrolysed Plant Protein Sales by Country (2019-2025) & (K MT)
Table 39. Europe Hydrolysed Plant Protein Sales by Country (2019-2025) & (K MT)
Table 40. Asia Pacific Hydrolysed Plant Protein Sales by Region (2019-2025) & (K MT)
Table 41. South America Hydrolysed Plant Protein Sales by Country (2019-2025) & (K MT)
Table 42. Middle East and Africa Hydrolysed Plant Protein Sales by Region (2019-2025) & (K MT)
Table 43. Global Hydrolysed Plant Protein Production (K MT) by Region (2019-2025)
Table 44. Global Hydrolysed Plant Protein Revenue (US$ Million) by Region (2019-2025)
Table 45. Global Hydrolysed Plant Protein Revenue Market Share by Region (2019-2025)
Table 46. Global Hydrolysed Plant Protein Production (K MT), Revenue (US$ Million), Price (USD/MT) and Gross Margin (2019-2025)
Table 47. North America Hydrolysed Plant Protein Production (K MT), Revenue (US$ Million), Price (USD/MT) and Gross Margin (2019-2025)
Table 48. Europe Hydrolysed Plant Protein Production (K MT), Revenue (US$ Million), Price (USD/MT) and Gross Margin (2019-2025)
Table 49. Japan Hydrolysed Plant Protein Production (K MT), Revenue (US$ Million), Price (USD/MT) and Gross Margin (2019-2025)
Table 50. China Hydrolysed Plant Protein Production (K MT), Revenue (US$ Million), Price (USD/MT) and Gross Margin (2019-2025)
Table 51. Tate and Lyle Hydrolysed Plant Protein Basic Information
Table 52. Tate and Lyle Hydrolysed Plant Protein Product Overview
Table 53. Tate and Lyle Hydrolysed Plant Protein Sales (K MT), Revenue (M USD), Price (USD/MT) and Gross Margin (2019-2025)
Table 54. Tate and Lyle Business Overview
Table 55. Tate and Lyle Hydrolysed Plant Protein SWOT Analysis
Table 56. Tate and Lyle Recent Developments
Table 57. Archer Daniels Midland Hydrolysed Plant Protein Basic Information
Table 58. Archer Daniels Midland Hydrolysed Plant Protein Product Overview
Table 59. Archer Daniels Midland Hydrolysed Plant Protein Sales (K MT), Revenue (M USD), Price (USD/MT) and Gross Margin (2019-2025)
Table 60. Archer Daniels Midland Business Overview
Table 61. Archer Daniels Midland Hydrolysed Plant Protein SWOT Analysis
Table 62. Archer Daniels Midland Recent Developments
Table 63. Exter Hydrolysed Plant Protein Basic Information
Table 64. Exter Hydrolysed Plant Protein Product Overview
Table 65. Exter Hydrolysed Plant Protein Sales (K MT), Revenue (M USD), Price (USD/MT) and Gross Margin (2019-2025)
Table 66. Exter Hydrolysed Plant Protein SWOT Analysis
Table 67. Exter Business Overview
Table 68. Exter Recent Developments
Table 69. Griffith Foods Hydrolysed Plant Protein Basic Information
Table 70. Griffith Foods Hydrolysed Plant Protein Product Overview
Table 71. Griffith Foods Hydrolysed Plant Protein Sales (K MT), Revenue (M USD), Price (USD/MT) and Gross Margin (2019-2025)
Table 72. Griffith Foods Business Overview
Table 73. Griffith Foods Recent Developments
Table 74. Sensient Technologies Hydrolysed Plant Protein Basic Information
Table 75. Sensient Technologies Hydrolysed Plant Protein Product Overview
Table 76. Sensient Technologies Hydrolysed Plant Protein Sales (K MT), Revenue (M USD), Price (USD/MT) and Gross Margin (2019-2025)
Table 77. Sensient Technologies Business Overview
Table 78. Sensient Technologies Recent Developments
Table 79. Vitana Hydrolysed Plant Protein Basic Information
Table 80. Vitana Hydrolysed Plant Protein Product Overview
Table 81. Vitana Hydrolysed Plant Protein Sales (K MT), Revenue (M USD), Price (USD/MT) and Gross Margin (2019-2025)
Table 82. Vitana Business Overview
Table 83. Vitana Recent Developments
Table 84. Kerry Hydrolysed Plant Protein Basic Information
Table 85. Kerry Hydrolysed Plant Protein Product Overview
Table 86. Kerry Hydrolysed Plant Protein Sales (K MT), Revenue (M USD), Price (USD/MT) and Gross Margin (2019-2025)
Table 87. Kerry Business Overview
Table 88. Kerry Recent Developments
Table 89. Aipu Hydrolysed Plant Protein Basic Information
Table 90. Aipu Hydrolysed Plant Protein Product Overview
Table 91. Aipu Hydrolysed Plant Protein Sales (K MT), Revenue (M USD), Price (USD/MT) and Gross Margin (2019-2025)
Table 92. Aipu Business Overview
Table 93. Aipu Recent Developments
Table 94. Cargill Hydrolysed Plant Protein Basic Information
Table 95. Cargill Hydrolysed Plant Protein Product Overview
Table 96. Cargill Hydrolysed Plant Protein Sales (K MT), Revenue (M USD), Price (USD/MT) and Gross Margin (2019-2025)
Table 97. Cargill Business Overview
Table 98. Cargill Recent Developments
Table 99. Basic Food Flavors Hydrolysed Plant Protein Basic Information
Table 100. Basic Food Flavors Hydrolysed Plant Protein Product Overview
Table 101. Basic Food Flavors Hydrolysed Plant Protein Sales (K MT), Revenue (M USD), Price (USD/MT) and Gross Margin (2019-2025)
Table 102. Basic Food Flavors Business Overview
Table 103. Basic Food Flavors Recent Developments
Table 104. San Soon Seng Food Industries Hydrolysed Plant Protein Basic Information
Table 105. San Soon Seng Food Industries Hydrolysed Plant Protein Product Overview
Table 106. San Soon Seng Food Industries Hydrolysed Plant Protein Sales (K MT), Revenue (M USD), Price (USD/MT) and Gross Margin (2019-2025)
Table 107. San Soon Seng Food Industries Business Overview
Table 108. San Soon Seng Food Industries Recent Developments
Table 109. Ajinomoto Hydrolysed Plant Protein Basic Information
Table 110. Ajinomoto Hydrolysed Plant Protein Product Overview
Table 111. Ajinomoto Hydrolysed Plant Protein Sales (K MT), Revenue (M USD), Price (USD/MT) and Gross Margin (2019-2025)
Table 112. Ajinomoto Business Overview
Table 113. Ajinomoto Recent Developments
Table 114. Global Hydrolysed Plant Protein Sales Forecast by Region (2025-2032) & (K MT)
Table 115. Global Hydrolysed Plant Protein Market Size Forecast by Region (2025-2032) & (M USD)
Table 116. North America Hydrolysed Plant Protein Sales Forecast by Country (2025-2032) & (K MT)
Table 117. North America Hydrolysed Plant Protein Market Size Forecast by Country (2025-2032) & (M USD)
Table 118. Europe Hydrolysed Plant Protein Sales Forecast by Country (2025-2032) & (K MT)
Table 119. Europe Hydrolysed Plant Protein Market Size Forecast by Country (2025-2032) & (M USD)
Table 120. Asia Pacific Hydrolysed Plant Protein Sales Forecast by Region (2025-2032) & (K MT)
Table 121. Asia Pacific Hydrolysed Plant Protein Market Size Forecast by Region (2025-2032) & (M USD)
Table 122. South America Hydrolysed Plant Protein Sales Forecast by Country (2025-2032) & (K MT)
Table 123. South America Hydrolysed Plant Protein Market Size Forecast by Country (2025-2032) & (M USD)
Table 124. Middle East and Africa Hydrolysed Plant Protein Consumption Forecast by Country (2025-2032) & (Units)
Table 125. Middle East and Africa Hydrolysed Plant Protein Market Size Forecast by Country (2025-2032) & (M USD)
Table 126. Global Hydrolysed Plant Protein Sales Forecast by Type (2025-2032) & (K MT)
Table 127. Global Hydrolysed Plant Protein Market Size Forecast by Type (2025-2032) & (M USD)
Table 128. Global Hydrolysed Plant Protein Price Forecast by Type (2025-2032) & (USD/MT)
Table 129. Global Hydrolysed Plant Protein Sales (K MT) Forecast by Application (2025-2032)
Table 130. Global Hydrolysed Plant Protein Market Size Forecast by Application (2025-2032) & (M USD)
List of Figures
Figure 1. Product Picture of Hydrolysed Plant Protein
Figure 2. Data Triangulation
Figure 3. Key Caveats
Figure 4. Global Hydrolysed Plant Protein Market Size (M USD), 2019-2032
Figure 5. Global Hydrolysed Plant Protein Market Size (M USD) (2019-2032)
Figure 6. Global Hydrolysed Plant Protein Sales (K MT) & (2019-2032)
Figure 7. Evaluation Matrix of Segment Market Development Potential (Type)
Figure 8. Evaluation Matrix of Segment Market Development Potential (Application)
Figure 9. Evaluation Matrix of Regional Market Development Potential
Figure 10. Hydrolysed Plant Protein Market Size by Country (M USD)
Figure 11. Hydrolysed Plant Protein Sales Share by Manufacturers in 2023
Figure 12. Global Hydrolysed Plant Protein Revenue Share by Manufacturers in 2023
Figure 13. Hydrolysed Plant Protein Market Share by Company Type (Tier 1, Tier 2 and Tier 3): 2023
Figure 14. Global Market Hydrolysed Plant Protein Average Price (USD/MT) of Key Manufacturers in 2023
Figure 15. The Global 5 and 10 Largest Players: Market Share by Hydrolysed Plant Protein Revenue in 2023
Figure 16. Evaluation Matrix of Segment Market Development Potential (Type)
Figure 17. Global Hydrolysed Plant Protein Market Share by Type
Figure 18. Sales Market Share of Hydrolysed Plant Protein by Type (2019-2025)
Figure 19. Sales Market Share of Hydrolysed Plant Protein by Type in 2023
Figure 20. Market Size Share of Hydrolysed Plant Protein by Type (2019-2025)
Figure 21. Market Size Market Share of Hydrolysed Plant Protein by Type in 2023
Figure 22. Evaluation Matrix of Segment Market Development Potential (Application)
Figure 23. Global Hydrolysed Plant Protein Market Share by Application
Figure 24. Global Hydrolysed Plant Protein Sales Market Share by Application (2019-2025)
Figure 25. Global Hydrolysed Plant Protein Sales Market Share by Application in 2023
Figure 26. Global Hydrolysed Plant Protein Market Share by Application (2019-2025)
Figure 27. Global Hydrolysed Plant Protein Market Share by Application in 2023
Figure 28. Global Hydrolysed Plant Protein Sales Growth Rate by Application (2019-2025)
Figure 29. Global Hydrolysed Plant Protein Sales Market Share by Region (2019-2025)
Figure 30. North America Hydrolysed Plant Protein Sales and Growth Rate (2019-2025) & (K MT)
Figure 31. North America Hydrolysed Plant Protein Sales Market Share by Country in 2023
Figure 32. U.S. Hydrolysed Plant Protein Sales and Growth Rate (2019-2025) & (K MT)
Figure 33. Canada Hydrolysed Plant Protein Sales (K MT) and Growth Rate (2019-2025)
Figure 34. Mexico Hydrolysed Plant Protein Sales (Units) and Growth Rate (2019-2025)
Figure 35. Europe Hydrolysed Plant Protein Sales and Growth Rate (2019-2025) & (K MT)
Figure 36. Europe Hydrolysed Plant Protein Sales Market Share by Country in 2023
Figure 37. Germany Hydrolysed Plant Protein Sales and Growth Rate (2019-2025) & (K MT)
Figure 38. France Hydrolysed Plant Protein Sales and Growth Rate (2019-2025) & (K MT)
Figure 39. U.K. Hydrolysed Plant Protein Sales and Growth Rate (2019-2025) & (K MT)
Figure 40. Italy Hydrolysed Plant Protein Sales and Growth Rate (2019-2025) & (K MT)
Figure 41. Russia Hydrolysed Plant Protein Sales and Growth Rate (2019-2025) & (K MT)
Figure 42. Asia Pacific Hydrolysed Plant Protein Sales and Growth Rate (K MT)
Figure 43. Asia Pacific Hydrolysed Plant Protein Sales Market Share by Region in 2023
Figure 44. China Hydrolysed Plant Protein Sales and Growth Rate (2019-2025) & (K MT)
Figure 45. Japan Hydrolysed Plant Protein Sales and Growth Rate (2019-2025) & (K MT)
Figure 46. South Korea Hydrolysed Plant Protein Sales and Growth Rate (2019-2025) & (K MT)
Figure 47. India Hydrolysed Plant Protein Sales and Growth Rate (2019-2025) & (K MT)
Figure 48. Southeast Asia Hydrolysed Plant Protein Sales and Growth Rate (2019-2025) & (K MT)
Figure 49. South America Hydrolysed Plant Protein Sales and Growth Rate (K MT)
Figure 50. South America Hydrolysed Plant Protein Sales Market Share by Country in 2023
Figure 51. Brazil Hydrolysed Plant Protein Sales and Growth Rate (2019-2025) & (K MT)
Figure 52. Argentina Hydrolysed Plant Protein Sales and Growth Rate (2019-2025) & (K MT)
Figure 53. Columbia Hydrolysed Plant Protein Sales and Growth Rate (2019-2025) & (K MT)
Figure 54. Middle East and Africa Hydrolysed Plant Protein Sales and Growth Rate (K MT)
Figure 55. Middle East and Africa Hydrolysed Plant Protein Sales Market Share by Region in 2023
Figure 56. Saudi Arabia Hydrolysed Plant Protein Sales and Growth Rate (2019-2025) & (K MT)
Figure 57. UAE Hydrolysed Plant Protein Sales and Growth Rate (2019-2025) & (K MT)
Figure 58. Egypt Hydrolysed Plant Protein Sales and Growth Rate (2019-2025) & (K MT)
Figure 59. Nigeria Hydrolysed Plant Protein Sales and Growth Rate (2019-2025) & (K MT)
Figure 60. South Africa Hydrolysed Plant Protein Sales and Growth Rate (2019-2025) & (K MT)
Figure 61. Global Hydrolysed Plant Protein Production Market Share by Region (2019-2025)
Figure 62. North America Hydrolysed Plant Protein Production (K MT) Growth Rate (2019-2025)
Figure 63. Europe Hydrolysed Plant Protein Production (K MT) Growth Rate (2019-2025)
Figure 64. Japan Hydrolysed Plant Protein Production (K MT) Growth Rate (2019-2025)
Figure 65. China Hydrolysed Plant Protein Production (K MT) Growth Rate (2019-2025)
Figure 66. Global Hydrolysed Plant Protein Sales Forecast by Volume (2019-2032) & (K MT)
Figure 67. Global Hydrolysed Plant Protein Market Size Forecast by Value (2019-2032) & (M USD)
Figure 68. Global Hydrolysed Plant Protein Sales Market Share Forecast by Type (2025-2032)
Figure 69. Global Hydrolysed Plant Protein Market Share Forecast by Type (2025-2032)
Figure 70. Global Hydrolysed Plant Protein Sales Forecast by Application (2025-2032)
Figure 71. Global Hydrolysed Plant Protein Market Share Forecast by Application (2025-2032)

