Navigation shoes represent an innovative fusion of footwear and technology, integrating navigation equipment directly into shoes. These shoes are equipped with embedded sensors and GPS technologies that provide real-time navigation assistance to the wearer. Whether used by travelers, adventurers, or those with visual impairments, these shoes help users navigate through unfamiliar environments by providing directional guidance, typically via vibration or audio cues. The technology embedded in navigation shoes is revolutionizing the way people interact with their surroundings, offering convenience, safety, and improved mobility.
Market Size
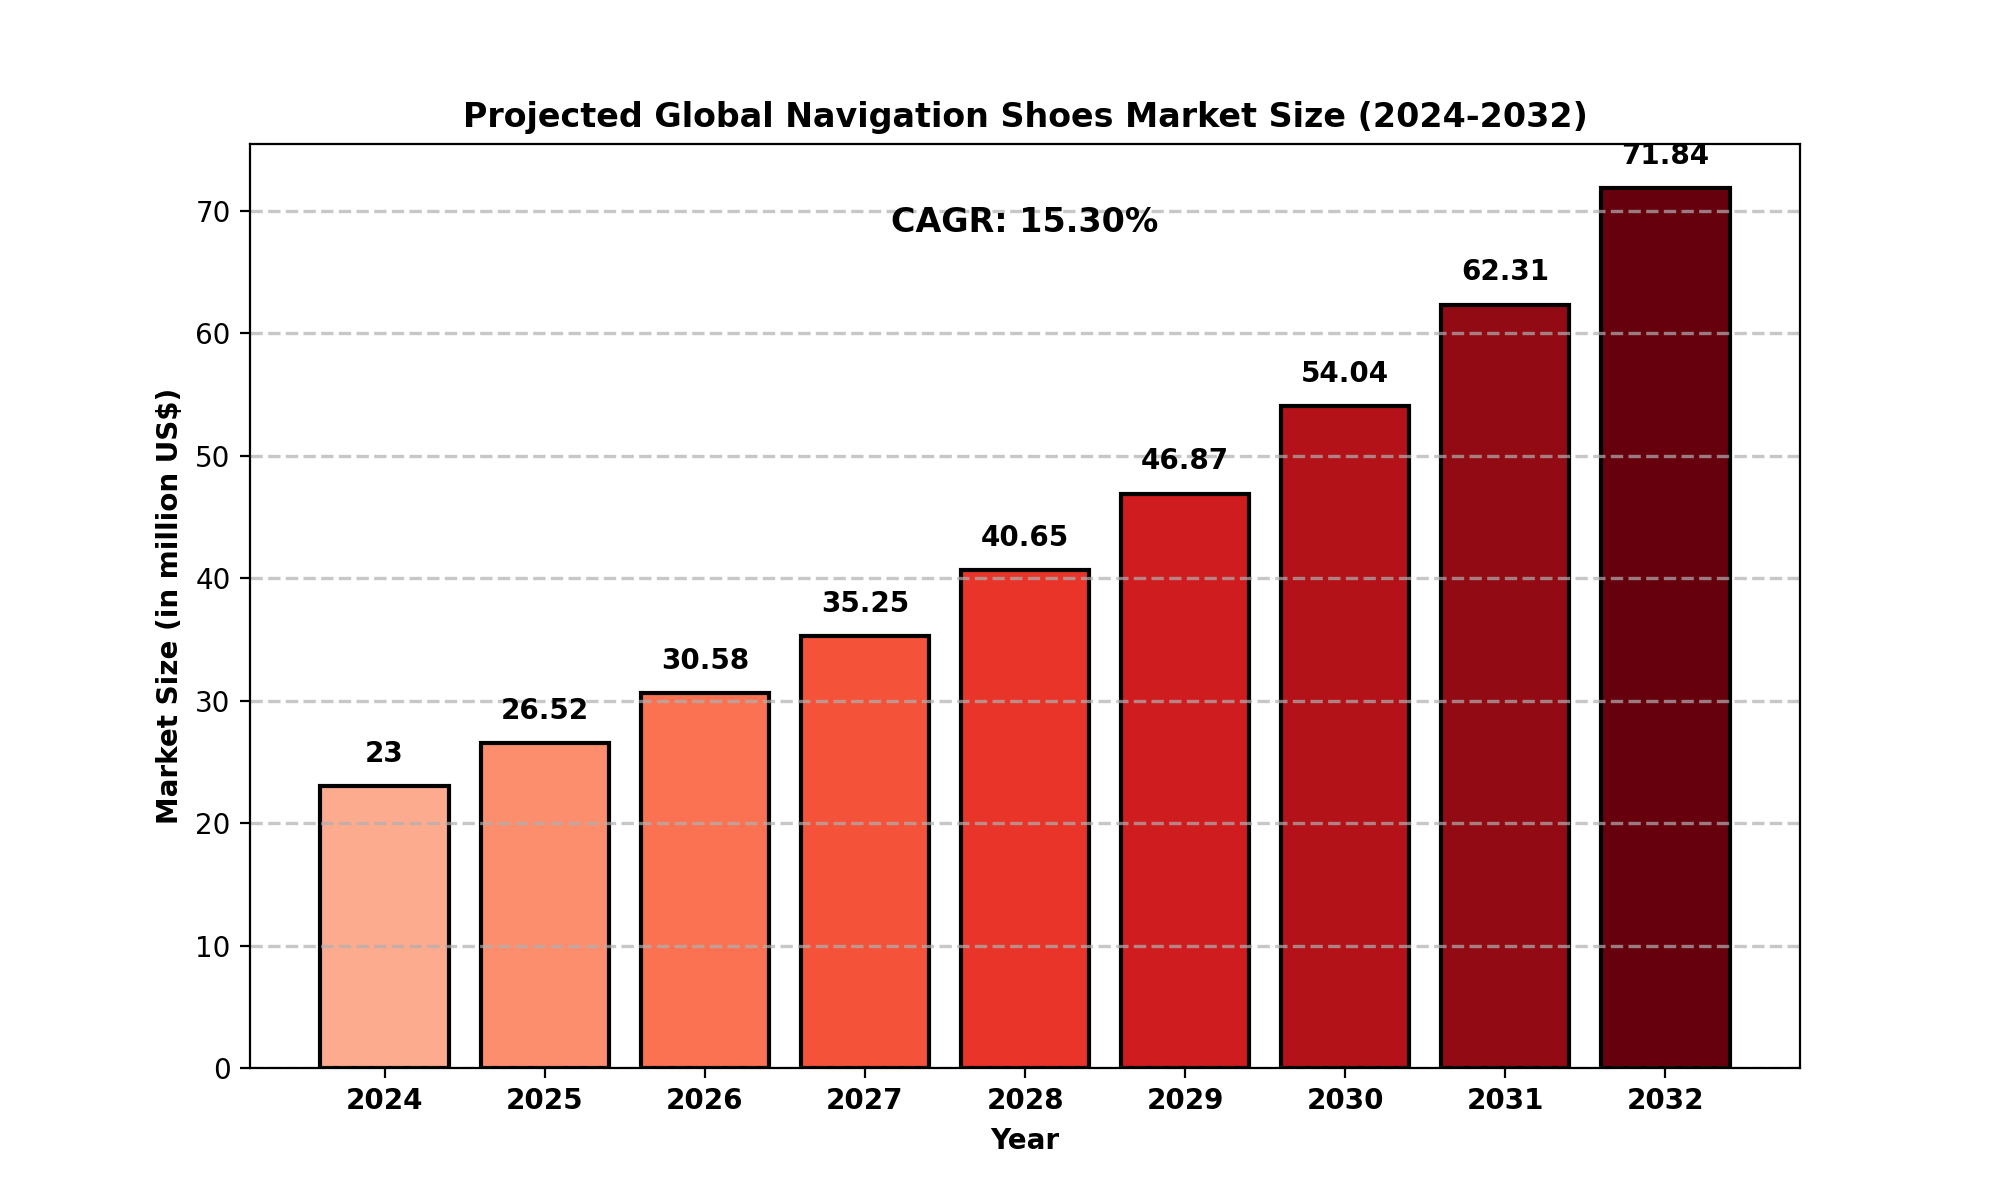
The global navigation shoes market was estimated to be worth USD 23 million in 2024. The market is expected to experience substantial growth, reaching USD 71.84 million by 2032, with a remarkable Compound Annual Growth Rate (CAGR) of 15.30% during the forecast period.
This growth is driven by increasing consumer interest in smart footwear solutions, as well as advancements in wearable technologies. The rising demand for multifunctional footwear that combines comfort with practical technological features is propelling this market's expansion. Furthermore, as GPS technology becomes more integrated into everyday devices, the potential for wearable navigation systems continues to rise.
Market Dynamics (Drivers, Restraints, Opportunities, and Challenges)
Drivers
The primary factors driving the growth of the navigation shoes market include:
-
Advancements in Wearable Technology: The continuous evolution of GPS and sensor technologies makes it easier and more affordable to integrate such systems into footwear.
-
Rising Interest in Fitness and Outdoor Activities: Consumers are increasingly engaging in outdoor sports, hiking, and fitness activities, which create a demand for products that assist in navigation during these experiences.
-
Growing Adoption of Smart Wearables: The rising trend of wearable tech, such as smartwatches, fitness trackers, and now smart shoes, has created a growing market for innovative footwear solutions that offer additional functionalities.
Restraints
Some of the factors limiting the market growth include:
-
High Manufacturing Costs: The integration of sophisticated technology into shoes increases production costs, making navigation shoes more expensive for consumers.
-
Technology Limitations: Despite advancements, there are still challenges in terms of accuracy and reliability of navigation systems, especially in areas with poor GPS signal coverage (e.g., dense urban environments or remote areas).
Opportunities
The market offers significant growth opportunities due to:
-
Expansion into New Segments: There is potential for expansion into new markets, such as elderly individuals or those with disabilities, who can benefit from real-time navigation aids.
-
Strategic Partnerships: Collaborations between footwear brands and tech companies to enhance the functionality of navigation shoes could unlock new opportunities and accelerate market penetration.
Challenges
Challenges that the industry faces include:
-
Technological Integration: Merging cutting-edge navigation systems with comfortable and stylish footwear remains a complex task for manufacturers.
-
Consumer Awareness and Adoption: Despite technological advancements, many consumers are still unaware of the existence and benefits of navigation shoes, which could slow market adoption.
Regional Analysis
The global market for navigation shoes is growing across various regions, with each showing unique trends and demands.
North America
In 2024, North America held a significant share of the navigation shoes market, valued at approximately USD 7.67 million. This region is expected to witness a steady growth rate of 13.11% during the forecast period. The demand for navigation shoes in North America is driven by the growing interest in outdoor activities, fitness trends, and the increasing adoption of smart technology. The United States, in particular, is a key market for wearable technologies, offering favorable conditions for the growth of navigation shoes.
Europe
Europe is another key market for navigation shoes, benefiting from increasing consumer demand for innovative products. Countries like the UK, Germany, and France are expected to lead the growth in this region. The high level of technological awareness and active lifestyle trends in Europe fuel the demand for such footwear solutions.
Asia-Pacific
The Asia-Pacific region presents significant potential for the navigation shoes market, primarily driven by rising disposable incomes, growing urbanization, and the increasing popularity of fitness and outdoor sports. Countries like China, Japan, and South Korea are expected to be major contributors to market growth, as consumers in these nations increasingly embrace wearable technology.
South America and Middle East & Africa
While these regions are expected to grow at a moderate pace, the demand for smart wearable products is expected to rise as economic conditions improve and consumer awareness increases.
Competitor Analysis
Several key players are driving the global navigation shoes market:
-
Nike: A global leader in the sportswear industry, Nike has begun to explore the integration of wearable technology in its footwear offerings.
-
Puma: Known for its innovations in sports and fitness apparel, Puma is also investing in wearable technology to diversify its product range.
-
Adidas: With its strong focus on innovative footwear, Adidas is continuously researching new ways to incorporate technology into its products.
-
Under Armour: Under Armour is expanding its reach into smart footwear, including shoes with GPS tracking systems.
-
Digitsole: A company specializing in smart insoles, Digitsole has developed wearable solutions for navigation shoes, offering advanced features like step counting and navigation aids.
Global Navigation Shoes Market: Market Segmentation Analysis
This report provides a deep insight into the global Navigation Shoes market, covering all its essential aspects. This ranges from a macro overview of the market to micro details of the market size, competitive landscape, development trend, niche market, key market drivers, and challenges, SWOT analysis, value chain analysis, etc.
The analysis helps the reader to shape the competition within the industries and strategies for the competitive environment to enhance the potential profit. Furthermore, it provides a simple framework for evaluating and assessing the position of the business organization. The report structure also focuses on the competitive landscape of the Global Navigation Shoes Market. This report introduces in detail the market share, market performance, product situation, operation situation, etc., of the main players, which helps the readers in the industry to identify the main competitors and deeply understand the competition pattern of the market.
In a word, this report is a must-read for industry players, investors, researchers, consultants, business strategists, and all those who have any kind of stake or are planning to foray into the Navigation Shoes market in any manner.
Market Segmentation (by Application)
Market Segmentation (by Type)
Key Company
-
Nike
-
Puma
-
Adidas
-
Li Ning
-
Salted Venture
-
Under Armour
-
Digitsole
-
Powerlace Technology
-
SolePower
Geographic Segmentation
-
North America (USA, Canada, Mexico)
-
Europe (Germany, UK, France, Russia, Italy, Rest of Europe)
-
Asia-Pacific (China, Japan, South Korea, India, Southeast Asia, Rest of Asia-Pacific)
-
South America (Brazil, Argentina, Columbia, Rest of South America)
-
The Middle East and Africa (Saudi Arabia, UAE, Egypt, Nigeria, South Africa, Rest of MEA)
FAQ Section
-
What is the current market size of the Navigation Shoes market?
-
The global navigation shoes market is estimated to be valued at USD 23 million in 2024.
-
Which are the key companies operating in the Navigation Shoes market? Major companies in the market include Nike, Puma, Adidas, Li Ning, Under Armour, and Digitsole.
-
What are the key growth drivers in the Navigation Shoes market? Growth drivers include advancements in wearable technology, the increasing demand for fitness and outdoor activity products, and the rise in consumer interest for multifunctional footwear.
-
Which regions dominate the Navigation Shoes market? North America and Europe are currently dominant regions, with significant growth expected from Asia-Pacific as well.
-
What are the emerging trends in the Navigation Shoes market? Key trends include the integration of advanced GPS systems in footwear, the rise of smart wearables, and the expansion of market applications to cater to specific demographics, such as children and elderly consumers.
Key Benefits of This Market Research:
- Industry drivers, restraints, and opportunities covered in the study
- Neutral perspective on the market performance
- Recent industry trends and developments
- Competitive landscape & strategies of key players
- Potential & niche segments and regions exhibiting promising growth covered
- Historical, current, and projected market size, in terms of value
- In-depth analysis of the Navigation Shoes Market
- Overview of the regional outlook of the Navigation Shoes Market:
Key Reasons to Buy this Report:
- Access to date statistics compiled by our researchers. These provide you with historical and forecast data, which is analyzed to tell you why your market is set to change
- This enables you to anticipate market changes to remain ahead of your competitors
- You will be able to copy data from the Excel spreadsheet straight into your marketing plans, business presentations, or other strategic documents
- The concise analysis, clear graph, and table format will enable you to pinpoint the information you require quickly
- Provision of market value data for each segment and sub-segment
- Indicates the region and segment that is expected to witness the fastest growth as well as to dominate the market
- Analysis by geography highlighting the consumption of the product/service in the region as well as indicating the factors that are affecting the market within each region
- Competitive landscape which incorporates the market ranking of the major players, along with new service/product launches, partnerships, business expansions, and acquisitions in the past five years of companies profiled
- Extensive company profiles comprising of company overview, company insights, product benchmarking, and SWOT analysis for the major market players
- The current as well as the future market outlook of the industry concerning recent developments which involve growth opportunities and drivers as well as challenges and restraints of both emerging as well as developed regions
- Includes in-depth analysis of the market from various perspectives through Porter
TABLE OF CONTENTS
Table of Contents
1 Research Methodology and Statistical Scope
1.1 Market Definition and Statistical Scope of Navigation Shoes
1.2 Key Market Segments
1.2.1 Navigation Shoes Segment by Type
1.2.2 Navigation Shoes Segment by Application
1.3 Methodology & Sources of Information
1.3.1 Research Methodology
1.3.2 Research Process
1.3.3 Market Breakdown and Data Triangulation
1.3.4 Base Year
1.3.5 Report Assumptions & Caveats
2 Navigation Shoes Market Overview
2.1 Global Market Overview
2.1.1 Global Navigation Shoes Market Size (M USD) Estimates and Forecasts (2019-2032)
2.1.2 Global Navigation Shoes Sales Estimates and Forecasts (2019-2032)
2.2 Market Segment Executive Summary
2.3 Global Market Size by Region
3 Navigation Shoes Market Competitive Landscape
3.1 Global Navigation Shoes Sales by Manufacturers (2019-2025)
3.2 Global Navigation Shoes Revenue Market Share by Manufacturers (2019-2025)
3.3 Navigation Shoes Market Share by Company Type (Tier 1, Tier 2, and Tier 3)
3.4 Global Navigation Shoes Average Price by Manufacturers (2019-2025)
3.5 Manufacturers Navigation Shoes Sales Sites, Area Served, Product Type
3.6 Navigation Shoes Market Competitive Situation and Trends
3.6.1 Navigation Shoes Market Concentration Rate
3.6.2 Global 5 and 10 Largest Navigation Shoes Players Market Share by Revenue
3.6.3 Mergers & Acquisitions, Expansion
4 Navigation Shoes Industry Chain Analysis
4.1 Navigation Shoes Industry Chain Analysis
4.2 Market Overview of Key Raw Materials
4.3 Midstream Market Analysis
4.4 Downstream Customer Analysis
5 The Development and Dynamics of Navigation Shoes Market
5.1 Key Development Trends
5.2 Driving Factors
5.3 Market Challenges
5.4 Market Restraints
5.5 Industry News
5.5.1 New Product Developments
5.5.2 Mergers & Acquisitions
5.5.3 Expansions
5.5.4 Collaboration/Supply Contracts
5.6 Industry Policies
6 Navigation Shoes Market Segmentation by Type
6.1 Evaluation Matrix of Segment Market Development Potential (Type)
6.2 Global Navigation Shoes Sales Market Share by Type (2019-2025)
6.3 Global Navigation Shoes Market Size Market Share by Type (2019-2025)
6.4 Global Navigation Shoes Price by Type (2019-2025)
7 Navigation Shoes Market Segmentation by Application
7.1 Evaluation Matrix of Segment Market Development Potential (Application)
7.2 Global Navigation Shoes Market Sales by Application (2019-2025)
7.3 Global Navigation Shoes Market Size (M USD) by Application (2019-2025)
7.4 Global Navigation Shoes Sales Growth Rate by Application (2019-2025)
8 Navigation Shoes Market Consumption by Region
8.1 Global Navigation Shoes Sales by Region
8.1.1 Global Navigation Shoes Sales by Region
8.1.2 Global Navigation Shoes Sales Market Share by Region
8.2 North America
8.2.1 North America Navigation Shoes Sales by Country
8.2.2 U.S.
8.2.3 Canada
8.2.4 Mexico
8.3 Europe
8.3.1 Europe Navigation Shoes Sales by Country
8.3.2 Germany
8.3.3 France
8.3.4 U.K.
8.3.5 Italy
8.3.6 Russia
8.4 Asia Pacific
8.4.1 Asia Pacific Navigation Shoes Sales by Region
8.4.2 China
8.4.3 Japan
8.4.4 South Korea
8.4.5 India
8.4.6 Southeast Asia
8.5 South America
8.5.1 South America Navigation Shoes Sales by Country
8.5.2 Brazil
8.5.3 Argentina
8.5.4 Columbia
8.6 Middle East and Africa
8.6.1 Middle East and Africa Navigation Shoes Sales by Region
8.6.2 Saudi Arabia
8.6.3 UAE
8.6.4 Egypt
8.6.5 Nigeria
8.6.6 South Africa
9 Navigation Shoes Market Production by Region
9.1 Global Production of Navigation Shoes by Region (2019-2025)
9.2 Global Navigation Shoes Revenue Market Share by Region (2019-2025)
9.3 Global Navigation Shoes Production, Revenue, Price and Gross Margin (2019-2025)
9.4 North America Navigation Shoes Production
9.4.1 North America Navigation Shoes Production Growth Rate (2019-2025)
9.4.2 North America Navigation Shoes Production, Revenue, Price and Gross Margin (2019-2025)
9.5 Europe Navigation Shoes Production
9.5.1 Europe Navigation Shoes Production Growth Rate (2019-2025)
9.5.2 Europe Navigation Shoes Production, Revenue, Price and Gross Margin (2019-2025)
9.6 Japan Navigation Shoes Production (2019-2025)
9.6.1 Japan Navigation Shoes Production Growth Rate (2019-2025)
9.6.2 Japan Navigation Shoes Production, Revenue, Price and Gross Margin (2019-2025)
9.7 China Navigation Shoes Production (2019-2025)
9.7.1 China Navigation Shoes Production Growth Rate (2019-2025)
9.7.2 China Navigation Shoes Production, Revenue, Price and Gross Margin (2019-2025)
10 Key Companies Profile
10.1 Nike
10.1.1 Nike Navigation Shoes Basic Information
10.1.2 Nike Navigation Shoes Product Overview
10.1.3 Nike Navigation Shoes Product Market Performance
10.1.4 Nike Business Overview
10.1.5 Nike Navigation Shoes SWOT Analysis
10.1.6 Nike Recent Developments
10.2 Puma
10.2.1 Puma Navigation Shoes Basic Information
10.2.2 Puma Navigation Shoes Product Overview
10.2.3 Puma Navigation Shoes Product Market Performance
10.2.4 Puma Business Overview
10.2.5 Puma Navigation Shoes SWOT Analysis
10.2.6 Puma Recent Developments
10.3 Adidas
10.3.1 Adidas Navigation Shoes Basic Information
10.3.2 Adidas Navigation Shoes Product Overview
10.3.3 Adidas Navigation Shoes Product Market Performance
10.3.4 Adidas Navigation Shoes SWOT Analysis
10.3.5 Adidas Business Overview
10.3.6 Adidas Recent Developments
10.4 Li Ning
10.4.1 Li Ning Navigation Shoes Basic Information
10.4.2 Li Ning Navigation Shoes Product Overview
10.4.3 Li Ning Navigation Shoes Product Market Performance
10.4.4 Li Ning Business Overview
10.4.5 Li Ning Recent Developments
10.5 Salted Venture
10.5.1 Salted Venture Navigation Shoes Basic Information
10.5.2 Salted Venture Navigation Shoes Product Overview
10.5.3 Salted Venture Navigation Shoes Product Market Performance
10.5.4 Salted Venture Business Overview
10.5.5 Salted Venture Recent Developments
10.6 Under Armour
10.6.1 Under Armour Navigation Shoes Basic Information
10.6.2 Under Armour Navigation Shoes Product Overview
10.6.3 Under Armour Navigation Shoes Product Market Performance
10.6.4 Under Armour Business Overview
10.6.5 Under Armour Recent Developments
10.7 Digitsole
10.7.1 Digitsole Navigation Shoes Basic Information
10.7.2 Digitsole Navigation Shoes Product Overview
10.7.3 Digitsole Navigation Shoes Product Market Performance
10.7.4 Digitsole Business Overview
10.7.5 Digitsole Recent Developments
10.8 Powerlace Technology
10.8.1 Powerlace Technology Navigation Shoes Basic Information
10.8.2 Powerlace Technology Navigation Shoes Product Overview
10.8.3 Powerlace Technology Navigation Shoes Product Market Performance
10.8.4 Powerlace Technology Business Overview
10.8.5 Powerlace Technology Recent Developments
10.9 SolePower
10.9.1 SolePower Navigation Shoes Basic Information
10.9.2 SolePower Navigation Shoes Product Overview
10.9.3 SolePower Navigation Shoes Product Market Performance
10.9.4 SolePower Business Overview
10.9.5 SolePower Recent Developments
11 Navigation Shoes Market Forecast by Region
11.1 Global Navigation Shoes Market Size Forecast
11.2 Global Navigation Shoes Market Forecast by Region
11.2.1 North America Market Size Forecast by Country
11.2.2 Europe Navigation Shoes Market Size Forecast by Country
11.2.3 Asia Pacific Navigation Shoes Market Size Forecast by Region
11.2.4 South America Navigation Shoes Market Size Forecast by Country
11.2.5 Middle East and Africa Forecasted Consumption of Navigation Shoes by Country
12 Forecast Market by Type and by Application (2025-2032)
12.1 Global Navigation Shoes Market Forecast by Type (2025-2032)
12.1.1 Global Forecasted Sales of Navigation Shoes by Type (2025-2032)
12.1.2 Global Navigation Shoes Market Size Forecast by Type (2025-2032)
12.1.3 Global Forecasted Price of Navigation Shoes by Type (2025-2032)
12.2 Global Navigation Shoes Market Forecast by Application (2025-2032)
12.2.1 Global Navigation Shoes Sales (K Units) Forecast by Application
12.2.2 Global Navigation Shoes Market Size (M USD) Forecast by Application (2025-2032)
13 Conclusion and Key Findings
LIST OF TABLES & FIGURES
List of Tables
Table 1. Introduction of the Type
Table 2. Introduction of the Application
Table 3. Market Size (M USD) Segment Executive Summary
Table 4. Navigation Shoes Market Size Comparison by Region (M USD)
Table 5. Global Navigation Shoes Sales (K Units) by Manufacturers (2019-2025)
Table 6. Global Navigation Shoes Sales Market Share by Manufacturers (2019-2025)
Table 7. Global Navigation Shoes Revenue (M USD) by Manufacturers (2019-2025)
Table 8. Global Navigation Shoes Revenue Share by Manufacturers (2019-2025)
Table 9. Company Type (Tier 1, Tier 2, and Tier 3) & (based on the Revenue in Navigation Shoes as of 2022)
Table 10. Global Market Navigation Shoes Average Price (USD/Unit) of Key Manufacturers (2019-2025)
Table 11. Manufacturers Navigation Shoes Sales Sites and Area Served
Table 12. Manufacturers Navigation Shoes Product Type
Table 13. Global Navigation Shoes Manufacturers Market Concentration Ratio (CR5 and HHI)
Table 14. Mergers & Acquisitions, Expansion Plans
Table 15. Industry Chain Map of Navigation Shoes
Table 16. Market Overview of Key Raw Materials
Table 17. Midstream Market Analysis
Table 18. Downstream Customer Analysis
Table 19. Key Development Trends
Table 20. Driving Factors
Table 21. Navigation Shoes Market Challenges
Table 22. Global Navigation Shoes Sales by Type (K Units)
Table 23. Global Navigation Shoes Market Size by Type (M USD)
Table 24. Global Navigation Shoes Sales (K Units) by Type (2019-2025)
Table 25. Global Navigation Shoes Sales Market Share by Type (2019-2025)
Table 26. Global Navigation Shoes Market Size (M USD) by Type (2019-2025)
Table 27. Global Navigation Shoes Market Size Share by Type (2019-2025)
Table 28. Global Navigation Shoes Price (USD/Unit) by Type (2019-2025)
Table 29. Global Navigation Shoes Sales (K Units) by Application
Table 30. Global Navigation Shoes Market Size by Application
Table 31. Global Navigation Shoes Sales by Application (2019-2025) & (K Units)
Table 32. Global Navigation Shoes Sales Market Share by Application (2019-2025)
Table 33. Global Navigation Shoes Sales by Application (2019-2025) & (M USD)
Table 34. Global Navigation Shoes Market Share by Application (2019-2025)
Table 35. Global Navigation Shoes Sales Growth Rate by Application (2019-2025)
Table 36. Global Navigation Shoes Sales by Region (2019-2025) & (K Units)
Table 37. Global Navigation Shoes Sales Market Share by Region (2019-2025)
Table 38. North America Navigation Shoes Sales by Country (2019-2025) & (K Units)
Table 39. Europe Navigation Shoes Sales by Country (2019-2025) & (K Units)
Table 40. Asia Pacific Navigation Shoes Sales by Region (2019-2025) & (K Units)
Table 41. South America Navigation Shoes Sales by Country (2019-2025) & (K Units)
Table 42. Middle East and Africa Navigation Shoes Sales by Region (2019-2025) & (K Units)
Table 43. Global Navigation Shoes Production (K Units) by Region (2019-2025)
Table 44. Global Navigation Shoes Revenue (US$ Million) by Region (2019-2025)
Table 45. Global Navigation Shoes Revenue Market Share by Region (2019-2025)
Table 46. Global Navigation Shoes Production (K Units), Revenue (US$ Million), Price (USD/Unit) and Gross Margin (2019-2025)
Table 47. North America Navigation Shoes Production (K Units), Revenue (US$ Million), Price (USD/Unit) and Gross Margin (2019-2025)
Table 48. Europe Navigation Shoes Production (K Units), Revenue (US$ Million), Price (USD/Unit) and Gross Margin (2019-2025)
Table 49. Japan Navigation Shoes Production (K Units), Revenue (US$ Million), Price (USD/Unit) and Gross Margin (2019-2025)
Table 50. China Navigation Shoes Production (K Units), Revenue (US$ Million), Price (USD/Unit) and Gross Margin (2019-2025)
Table 51. Nike Navigation Shoes Basic Information
Table 52. Nike Navigation Shoes Product Overview
Table 53. Nike Navigation Shoes Sales (K Units), Revenue (M USD), Price (USD/Unit) and Gross Margin (2019-2025)
Table 54. Nike Business Overview
Table 55. Nike Navigation Shoes SWOT Analysis
Table 56. Nike Recent Developments
Table 57. Puma Navigation Shoes Basic Information
Table 58. Puma Navigation Shoes Product Overview
Table 59. Puma Navigation Shoes Sales (K Units), Revenue (M USD), Price (USD/Unit) and Gross Margin (2019-2025)
Table 60. Puma Business Overview
Table 61. Puma Navigation Shoes SWOT Analysis
Table 62. Puma Recent Developments
Table 63. Adidas Navigation Shoes Basic Information
Table 64. Adidas Navigation Shoes Product Overview
Table 65. Adidas Navigation Shoes Sales (K Units), Revenue (M USD), Price (USD/Unit) and Gross Margin (2019-2025)
Table 66. Adidas Navigation Shoes SWOT Analysis
Table 67. Adidas Business Overview
Table 68. Adidas Recent Developments
Table 69. Li Ning Navigation Shoes Basic Information
Table 70. Li Ning Navigation Shoes Product Overview
Table 71. Li Ning Navigation Shoes Sales (K Units), Revenue (M USD), Price (USD/Unit) and Gross Margin (2019-2025)
Table 72. Li Ning Business Overview
Table 73. Li Ning Recent Developments
Table 74. Salted Venture Navigation Shoes Basic Information
Table 75. Salted Venture Navigation Shoes Product Overview
Table 76. Salted Venture Navigation Shoes Sales (K Units), Revenue (M USD), Price (USD/Unit) and Gross Margin (2019-2025)
Table 77. Salted Venture Business Overview
Table 78. Salted Venture Recent Developments
Table 79. Under Armour Navigation Shoes Basic Information
Table 80. Under Armour Navigation Shoes Product Overview
Table 81. Under Armour Navigation Shoes Sales (K Units), Revenue (M USD), Price (USD/Unit) and Gross Margin (2019-2025)
Table 82. Under Armour Business Overview
Table 83. Under Armour Recent Developments
Table 84. Digitsole Navigation Shoes Basic Information
Table 85. Digitsole Navigation Shoes Product Overview
Table 86. Digitsole Navigation Shoes Sales (K Units), Revenue (M USD), Price (USD/Unit) and Gross Margin (2019-2025)
Table 87. Digitsole Business Overview
Table 88. Digitsole Recent Developments
Table 89. Powerlace Technology Navigation Shoes Basic Information
Table 90. Powerlace Technology Navigation Shoes Product Overview
Table 91. Powerlace Technology Navigation Shoes Sales (K Units), Revenue (M USD), Price (USD/Unit) and Gross Margin (2019-2025)
Table 92. Powerlace Technology Business Overview
Table 93. Powerlace Technology Recent Developments
Table 94. SolePower Navigation Shoes Basic Information
Table 95. SolePower Navigation Shoes Product Overview
Table 96. SolePower Navigation Shoes Sales (K Units), Revenue (M USD), Price (USD/Unit) and Gross Margin (2019-2025)
Table 97. SolePower Business Overview
Table 98. SolePower Recent Developments
Table 99. Global Navigation Shoes Sales Forecast by Region (2025-2032) & (K Units)
Table 100. Global Navigation Shoes Market Size Forecast by Region (2025-2032) & (M USD)
Table 101. North America Navigation Shoes Sales Forecast by Country (2025-2032) & (K Units)
Table 102. North America Navigation Shoes Market Size Forecast by Country (2025-2032) & (M USD)
Table 103. Europe Navigation Shoes Sales Forecast by Country (2025-2032) & (K Units)
Table 104. Europe Navigation Shoes Market Size Forecast by Country (2025-2032) & (M USD)
Table 105. Asia Pacific Navigation Shoes Sales Forecast by Region (2025-2032) & (K Units)
Table 106. Asia Pacific Navigation Shoes Market Size Forecast by Region (2025-2032) & (M USD)
Table 107. South America Navigation Shoes Sales Forecast by Country (2025-2032) & (K Units)
Table 108. South America Navigation Shoes Market Size Forecast by Country (2025-2032) & (M USD)
Table 109. Middle East and Africa Navigation Shoes Consumption Forecast by Country (2025-2032) & (Units)
Table 110. Middle East and Africa Navigation Shoes Market Size Forecast by Country (2025-2032) & (M USD)
Table 111. Global Navigation Shoes Sales Forecast by Type (2025-2032) & (K Units)
Table 112. Global Navigation Shoes Market Size Forecast by Type (2025-2032) & (M USD)
Table 113. Global Navigation Shoes Price Forecast by Type (2025-2032) & (USD/Unit)
Table 114. Global Navigation Shoes Sales (K Units) Forecast by Application (2025-2032)
Table 115. Global Navigation Shoes Market Size Forecast by Application (2025-2032) & (M USD)
List of Figures
Figure 1. Product Picture of Navigation Shoes
Figure 2. Data Triangulation
Figure 3. Key Caveats
Figure 4. Global Navigation Shoes Market Size (M USD), 2019-2032
Figure 5. Global Navigation Shoes Market Size (M USD) (2019-2032)
Figure 6. Global Navigation Shoes Sales (K Units) & (2019-2032)
Figure 7. Evaluation Matrix of Segment Market Development Potential (Type)
Figure 8. Evaluation Matrix of Segment Market Development Potential (Application)
Figure 9. Evaluation Matrix of Regional Market Development Potential
Figure 10. Navigation Shoes Market Size by Country (M USD)
Figure 11. Navigation Shoes Sales Share by Manufacturers in 2023
Figure 12. Global Navigation Shoes Revenue Share by Manufacturers in 2023
Figure 13. Navigation Shoes Market Share by Company Type (Tier 1, Tier 2 and Tier 3): 2023
Figure 14. Global Market Navigation Shoes Average Price (USD/Unit) of Key Manufacturers in 2023
Figure 15. The Global 5 and 10 Largest Players: Market Share by Navigation Shoes Revenue in 2023
Figure 16. Evaluation Matrix of Segment Market Development Potential (Type)
Figure 17. Global Navigation Shoes Market Share by Type
Figure 18. Sales Market Share of Navigation Shoes by Type (2019-2025)
Figure 19. Sales Market Share of Navigation Shoes by Type in 2023
Figure 20. Market Size Share of Navigation Shoes by Type (2019-2025)
Figure 21. Market Size Market Share of Navigation Shoes by Type in 2023
Figure 22. Evaluation Matrix of Segment Market Development Potential (Application)
Figure 23. Global Navigation Shoes Market Share by Application
Figure 24. Global Navigation Shoes Sales Market Share by Application (2019-2025)
Figure 25. Global Navigation Shoes Sales Market Share by Application in 2023
Figure 26. Global Navigation Shoes Market Share by Application (2019-2025)
Figure 27. Global Navigation Shoes Market Share by Application in 2023
Figure 28. Global Navigation Shoes Sales Growth Rate by Application (2019-2025)
Figure 29. Global Navigation Shoes Sales Market Share by Region (2019-2025)
Figure 30. North America Navigation Shoes Sales and Growth Rate (2019-2025) & (K Units)
Figure 31. North America Navigation Shoes Sales Market Share by Country in 2023
Figure 32. U.S. Navigation Shoes Sales and Growth Rate (2019-2025) & (K Units)
Figure 33. Canada Navigation Shoes Sales (K Units) and Growth Rate (2019-2025)
Figure 34. Mexico Navigation Shoes Sales (Units) and Growth Rate (2019-2025)
Figure 35. Europe Navigation Shoes Sales and Growth Rate (2019-2025) & (K Units)
Figure 36. Europe Navigation Shoes Sales Market Share by Country in 2023
Figure 37. Germany Navigation Shoes Sales and Growth Rate (2019-2025) & (K Units)
Figure 38. France Navigation Shoes Sales and Growth Rate (2019-2025) & (K Units)
Figure 39. U.K. Navigation Shoes Sales and Growth Rate (2019-2025) & (K Units)
Figure 40. Italy Navigation Shoes Sales and Growth Rate (2019-2025) & (K Units)
Figure 41. Russia Navigation Shoes Sales and Growth Rate (2019-2025) & (K Units)
Figure 42. Asia Pacific Navigation Shoes Sales and Growth Rate (K Units)
Figure 43. Asia Pacific Navigation Shoes Sales Market Share by Region in 2023
Figure 44. China Navigation Shoes Sales and Growth Rate (2019-2025) & (K Units)
Figure 45. Japan Navigation Shoes Sales and Growth Rate (2019-2025) & (K Units)
Figure 46. South Korea Navigation Shoes Sales and Growth Rate (2019-2025) & (K Units)
Figure 47. India Navigation Shoes Sales and Growth Rate (2019-2025) & (K Units)
Figure 48. Southeast Asia Navigation Shoes Sales and Growth Rate (2019-2025) & (K Units)
Figure 49. South America Navigation Shoes Sales and Growth Rate (K Units)
Figure 50. South America Navigation Shoes Sales Market Share by Country in 2023
Figure 51. Brazil Navigation Shoes Sales and Growth Rate (2019-2025) & (K Units)
Figure 52. Argentina Navigation Shoes Sales and Growth Rate (2019-2025) & (K Units)
Figure 53. Columbia Navigation Shoes Sales and Growth Rate (2019-2025) & (K Units)
Figure 54. Middle East and Africa Navigation Shoes Sales and Growth Rate (K Units)
Figure 55. Middle East and Africa Navigation Shoes Sales Market Share by Region in 2023
Figure 56. Saudi Arabia Navigation Shoes Sales and Growth Rate (2019-2025) & (K Units)
Figure 57. UAE Navigation Shoes Sales and Growth Rate (2019-2025) & (K Units)
Figure 58. Egypt Navigation Shoes Sales and Growth Rate (2019-2025) & (K Units)
Figure 59. Nigeria Navigation Shoes Sales and Growth Rate (2019-2025) & (K Units)
Figure 60. South Africa Navigation Shoes Sales and Growth Rate (2019-2025) & (K Units)
Figure 61. Global Navigation Shoes Production Market Share by Region (2019-2025)
Figure 62. North America Navigation Shoes Production (K Units) Growth Rate (2019-2025)
Figure 63. Europe Navigation Shoes Production (K Units) Growth Rate (2019-2025)
Figure 64. Japan Navigation Shoes Production (K Units) Growth Rate (2019-2025)
Figure 65. China Navigation Shoes Production (K Units) Growth Rate (2019-2025)
Figure 66. Global Navigation Shoes Sales Forecast by Volume (2019-2032) & (K Units)
Figure 67. Global Navigation Shoes Market Size Forecast by Value (2019-2032) & (M USD)
Figure 68. Global Navigation Shoes Sales Market Share Forecast by Type (2025-2032)
Figure 69. Global Navigation Shoes Market Share Forecast by Type (2025-2032)
Figure 70. Global Navigation Shoes Sales Forecast by Application (2025-2032)
Figure 71. Global Navigation Shoes Market Share Forecast by Application (2025-2032)

