Natural soap refers to soap that is created using only organic, plant-based ingredients and free from synthetic chemicals or artificial additives. These soaps are often crafted using methods such as cold pressing or saponification, preserving the beneficial properties of natural ingredients like essential oils, herbs, and plant-based fats. A lot of people turn to natural soaps due to their gentle nature, suitability for sensitive skin, and alignment with sustainable, eco-friendly practices. Organic and natural soaps are often used interchangeably in the market, although "organic" typically refers to the farming practices of the ingredients used in soap production.
The natural soap market has grown steadily as consumers become more aware of the potential harm that chemicals in traditional skincare products may cause. These soaps are favored for their environmental and health benefits, often marketed as free from parabens, sulfates, and artificial fragrances. This global shift toward eco-conscious and wellness-oriented skincare solutions is propelling the demand for natural soaps in various regions.
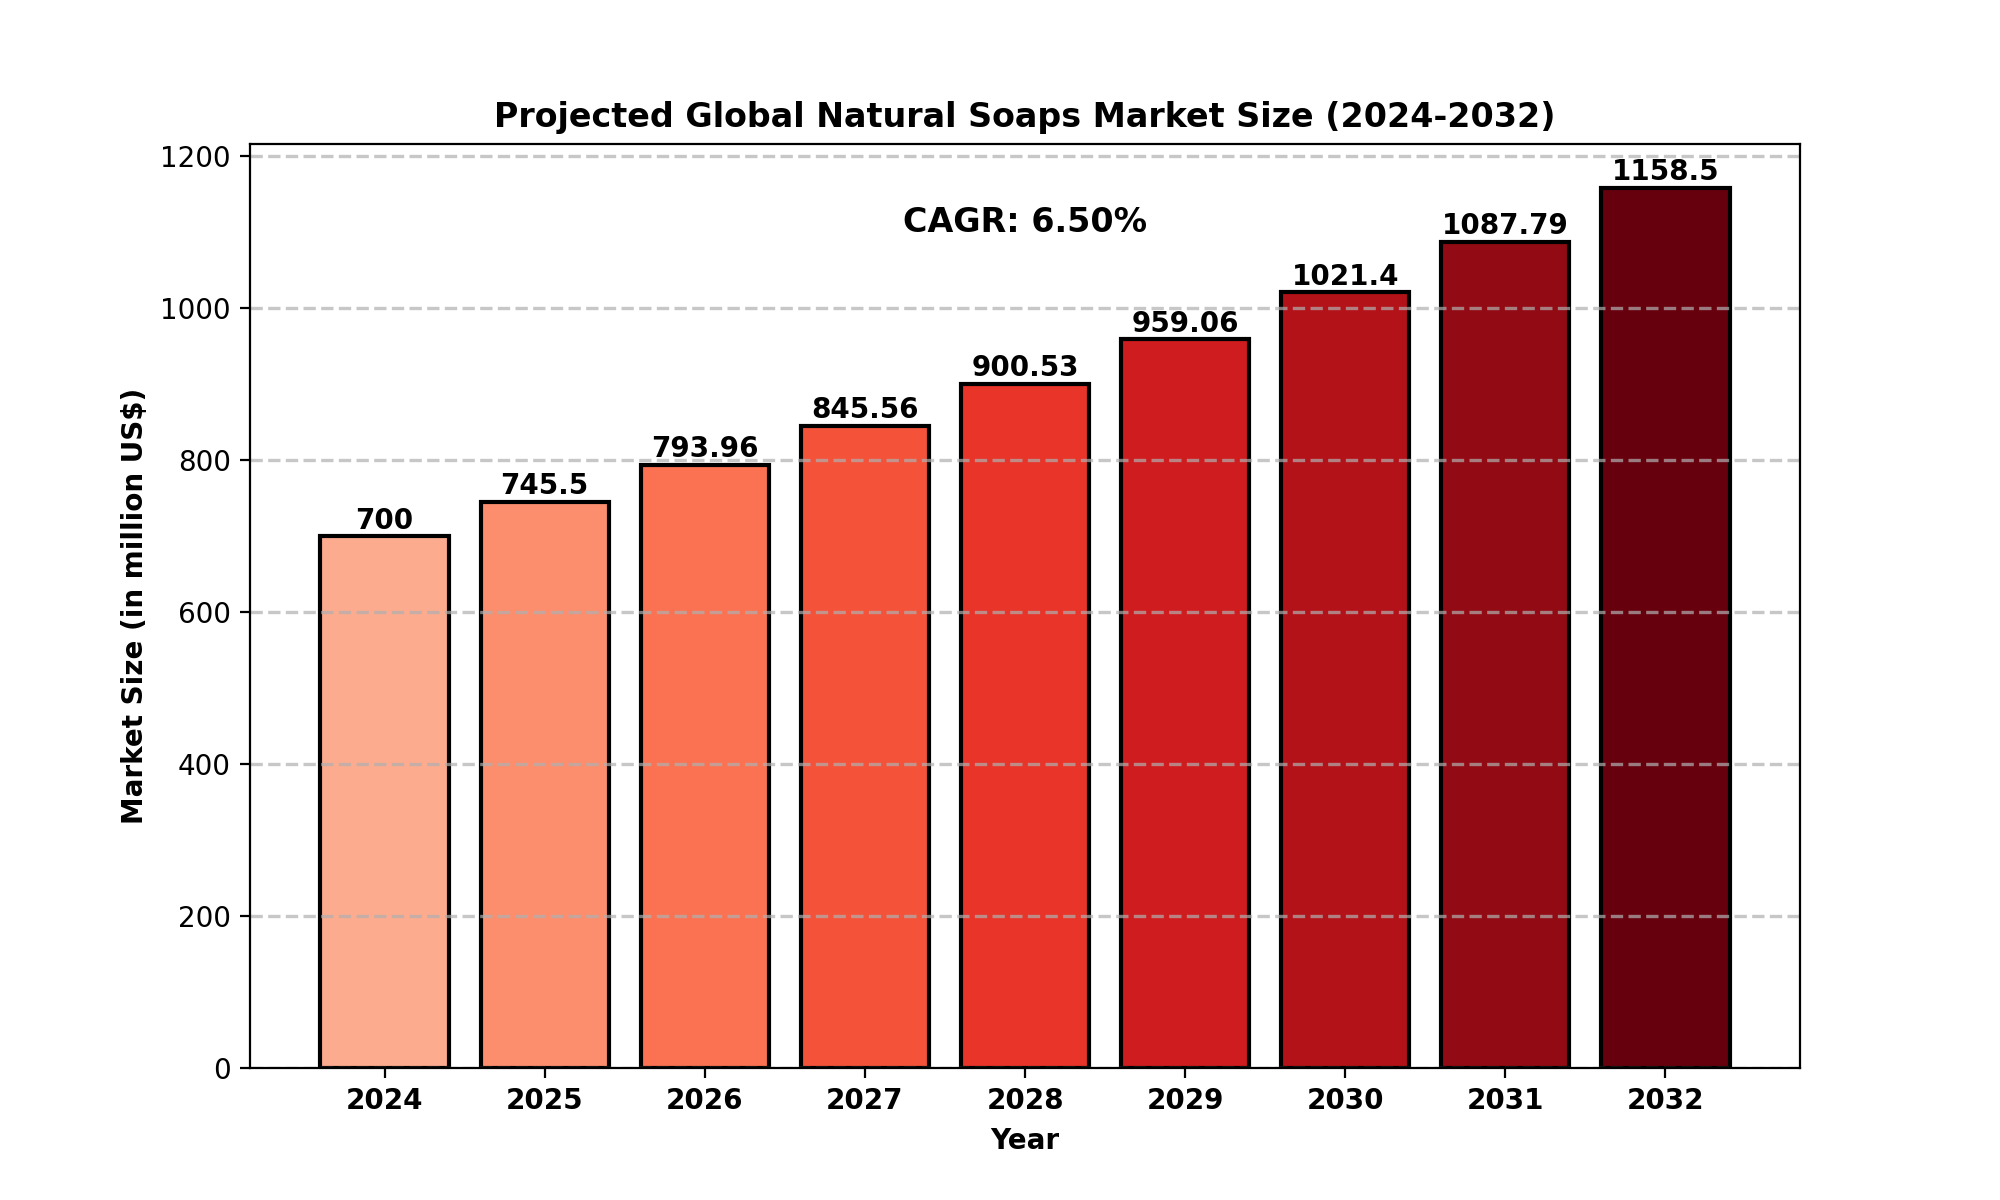
Market Size
The global natural soaps market size was estimated at USD 700 million in 2024 and is expected to grow significantly, reaching USD 1.15 billion by 2032.This represents a compound annual growth rate (CAGR) of 6.50% from 2024 to 2032.
The rising consumer preference for organic and natural products, driven by increasing health awareness and sustainability concerns, is fueling this growth. The natural soaps market, although currently small in comparison to the traditional soap market, is experiencing rapid expansion as more consumers shift towards natural, toxin-free alternatives.
The increase in disposable incomes, the rise of e-commerce platforms, and the growing awareness regarding the benefits of using natural products are all contributing to the market’s upward trajectory. Consumers are becoming more mindful of their health and the environment, thus fostering demand for products that are both sustainable and beneficial to their skin.
Market Dynamics (Drivers, Restraints, Opportunities, and Challenges)
Drivers:
-
Health and Wellness Trends: As more people become aware of the potential dangers of chemicals in personal care products, there is a growing preference for organic and natural alternatives. This shift is driving the demand for natural soaps.
-
Environmental Sustainability: The global push for sustainability and eco-conscious living is a major factor in the growth of the natural soaps market. Consumers are increasingly choosing products that are biodegradable and come in recyclable or minimal packaging.
-
Increasing Skin Sensitivity Awareness: With more individuals experiencing sensitive skin issues, including irritation from synthetic chemicals, there is a growing preference for gentle, natural products such as organic soaps. These are less likely to trigger allergic reactions or cause skin problems.
-
Expansion of E-Commerce Platforms: Online shopping provides a convenient way for consumers to access natural and organic soap brands, even in regions where such products were previously unavailable. This has opened up new opportunities for market expansion.
Restraints:
-
Higher Cost of Production: Natural soaps often come with a higher price tag due to the cost of organic ingredients and sustainable production processes. This can deter price-sensitive consumers from making the switch from conventional soaps.
-
Lack of Awareness in Emerging Markets: While there is growing awareness about natural soaps in developed countries, many emerging markets are still unfamiliar with the benefits of organic products. This limits the growth of the market in certain regions.
-
Competition from Traditional Soap Manufacturers: Conventional soap brands continue to dominate the market with established distribution channels, extensive marketing, and lower prices. Competing with these large, well-established players remains a challenge for natural soap producers.
Opportunities:
-
Rising Popularity of Eco-Friendly Products: As the focus on sustainability increases, natural soap manufacturers can capitalize on the growing trend of eco-conscious consumption by highlighting the environmental benefits of their products.
-
Product Innovation: There is ample opportunity for innovation within the natural soap segment, particularly through unique formulations, exotic ingredients, and novel packaging solutions. This could attract new customers looking for personalized or premium skincare experiences.
-
Untapped Markets: Emerging markets present significant growth opportunities for natural soap companies. As disposable incomes rise and consumers become more health-conscious, companies can expand their reach into these regions.
Challenges:
-
Regulatory Challenges: Navigating the complex regulations surrounding organic labeling and product certifications can be a barrier to entry for new players in the natural soaps market.
-
Supply Chain Limitations: The sourcing of high-quality natural and organic ingredients may face challenges related to seasonality, availability, and ethical sourcing practices. This could affect production and price stability.
-
Consumer Perception of Efficacy: Although natural soaps are marketed for their skin-friendly properties, there are consumers who may remain skeptical about the efficacy of these products compared to chemical-laden alternatives. Convincing these consumers can be a hurdle.
Regional Analysis
North America
The North American market for natural soaps was valued at USD 203.29 million in 2024 and is projected to grow at a CAGR of 5.57% during the forecast period from 2025 to 2032. The United States and Canada dominate the market, driven by increasing consumer awareness about the health benefits of organic products. The rise of e-commerce platforms and eco-conscious consumerism are significant factors contributing to growth in this region.
Europe
Europe holds a prominent share in the global market, with countries like Germany, the UK, and France witnessing high demand for natural personal care products. European consumers are highly inclined towards organic products, making this region a strong market for natural soaps. The presence of key manufacturers and increasing awareness about sustainable skincare are key growth drivers.
Asia-Pacific
In the Asia-Pacific region, countries such as China, Japan, and India are showing an increased interest in natural skincare products due to rising disposable incomes, better access to e-commerce, and greater awareness about personal health and wellness. As the region's middle class grows, the demand for natural soaps is expected to witness a significant rise.
South America
The market in South America, including Brazil and Argentina, is in its early stages but is growing steadily. Increasing awareness about the harmful effects of synthetic chemicals and a shift towards more sustainable living practices are driving the demand for natural soaps in this region.
The Middle East and Africa
The Middle East and Africa region is seeing growing interest in natural soaps, especially in countries like Saudi Arabia, UAE, and South Africa, where there is a rising focus on organic personal care products. The growing adoption of e-commerce and a shift towards sustainable consumption are contributing factors.
Competitor Analysis (in brief)
The global natural soaps market features a wide array of brands, with key players including:
These companies have established themselves as leaders in the natural soap market through innovation, high-quality product offerings, and a focus on sustainability. Their competitive strategies revolve around eco-friendly packaging, product diversification, and partnerships with e-commerce platforms.
Key Company
Market Segmentation (by Application)
This report provides a deep insight into the global Natural Soaps market, covering all its essential aspects. This ranges from a macro overview of the market to micro details of the market size, competitive landscape, development trend, niche market, key market drivers and challenges, SWOT analysis, value chain analysis, etc.
The analysis helps the reader to shape the competition within the industries and strategies for the competitive environment to enhance the potential profit. Furthermore, it provides a simple framework for evaluating and assessing the position of the business organization. The report structure also focuses on the competitive landscape of the Global Natural Soaps Market. This report introduces in detail the market share, market performance, product situation, operation situation, etc., of the main players, which helps the readers in the industry to identify the main competitors and deeply understand the competition pattern of the market.
In a word, this report is a must-read for industry players, investors, researchers, consultants, business strategists, and all those who have any kind of stake or are planning to foray into the Natural Soaps market in any manner.
Market Segmentation (by Type)
-
Natural Bar Soap
-
Natural Liquid Soap
Geographic Segmentation
-
North America (USA, Canada, Mexico)
-
Europe (Germany, UK, France, Russia, Italy, Rest of Europe)
-
Asia-Pacific (China, Japan, South Korea, India, Southeast Asia, Rest of Asia-Pacific)
-
South America (Brazil, Argentina, Columbia, Rest of South America)
-
The Middle East and Africa (Saudi Arabia, UAE, Egypt, Nigeria, South Africa, Rest of MEA)
FAQ Section
What is the current market size of Natural Soaps?
Which are the key companies operating in the Natural Soaps market?
-
Key companies include Sundial Brands LLC, EO Products, Vi-Tae, Pangea Organics, Neal's Yard (Natural Remedies) Limited, and many others.
What are the key growth drivers in the Natural Soaps market?
Which regions dominate the Natural Soaps market?
-
North America, Europe, and Asia-Pacific dominate the natural soaps market, with strong demand from the USA, Germany, France, Japan, and China.
What are the emerging trends in the Natural Soaps market?
Key Benefits of This Market Research:
-
Industry drivers, restraints, and opportunities covered in the study
-
Neutral perspective on the market performance
-
Recent industry trends and developments
-
Competitive landscape & strategies of key players
-
Potential & niche segments and regions exhibiting promising growth covered
-
Historical, current, and projected market size, in terms of value
-
In-depth analysis of the Natural Soaps Market
-
Overview of the regional outlook of the Natural Soaps Market:
Key Reasons to Buy this Report:
-
Access to date statistics compiled by our researchers. These provide you with historical and forecast data, which is analyzed to tell you why your market is set to change
-
This enables you to anticipate market changes to remain ahead of your competitors
-
You will be able to copy data from the Excel spreadsheet straight into your marketing plans, business presentations, or other strategic documents
-
The concise analysis, clear graph, and table format will enable you to pinpoint the information you require quickly
-
Provision of market value data for each segment and sub-segment
-
Indicates the region and segment that is expected to witness the fastest growth as well as to dominate the market
-
Analysis by geography highlighting the consumption of the product/service in the region as well as indicating the factors that are affecting the market within each region
-
Competitive landscape which incorporates the market ranking of the major players, along with new service/product launches, partnerships, business expansions, and acquisitions in the past five years of companies profiled
-
Extensive company profiles comprising of company overview, company insights, product benchmarking, and SWOT analysis for the major market players
-
The current as well as the future market outlook of the industry concerning recent developments which involve growth opportunities and drivers as well as challenges and restraints of both emerging as well as developed regions
-
Includes in-depth analysis of the market from various perspectives through Porter
TABLE OF CONTENTS
Table of Contents
1 Research Methodology and Statistical Scope
1.1 Market Definition and Statistical Scope of Natural Soaps
1.2 Key Market Segments
1.2.1 Natural Soaps Segment by Type
1.2.2 Natural Soaps Segment by Application
1.3 Methodology & Sources of Information
1.3.1 Research Methodology
1.3.2 Research Process
1.3.3 Market Breakdown and Data Triangulation
1.3.4 Base Year
1.3.5 Report Assumptions & Caveats
2 Natural Soaps Market Overview
2.1 Global Market Overview
2.1.1 Global Natural Soaps Market Size (M USD) Estimates and Forecasts (2019-2032)
2.1.2 Global Natural Soaps Sales Estimates and Forecasts (2019-2032)
2.2 Market Segment Executive Summary
2.3 Global Market Size by Region
3 Natural Soaps Market Competitive Landscape
3.1 Global Natural Soaps Sales by Manufacturers (2019-2025)
3.2 Global Natural Soaps Revenue Market Share by Manufacturers (2019-2025)
3.3 Natural Soaps Market Share by Company Type (Tier 1, Tier 2, and Tier 3)
3.4 Global Natural Soaps Average Price by Manufacturers (2019-2025)
3.5 Manufacturers Natural Soaps Sales Sites, Area Served, Product Type
3.6 Natural Soaps Market Competitive Situation and Trends
3.6.1 Natural Soaps Market Concentration Rate
3.6.2 Global 5 and 10 Largest Natural Soaps Players Market Share by Revenue
3.6.3 Mergers & Acquisitions, Expansion
4 Natural Soaps Industry Chain Analysis
4.1 Natural Soaps Industry Chain Analysis
4.2 Market Overview of Key Raw Materials
4.3 Midstream Market Analysis
4.4 Downstream Customer Analysis
5 The Development and Dynamics of Natural Soaps Market
5.1 Key Development Trends
5.2 Driving Factors
5.3 Market Challenges
5.4 Market Restraints
5.5 Industry News
5.5.1 New Product Developments
5.5.2 Mergers & Acquisitions
5.5.3 Expansions
5.5.4 Collaboration/Supply Contracts
5.6 Industry Policies
6 Natural Soaps Market Segmentation by Type
6.1 Evaluation Matrix of Segment Market Development Potential (Type)
6.2 Global Natural Soaps Sales Market Share by Type (2019-2025)
6.3 Global Natural Soaps Market Size Market Share by Type (2019-2025)
6.4 Global Natural Soaps Price by Type (2019-2025)
7 Natural Soaps Market Segmentation by Application
7.1 Evaluation Matrix of Segment Market Development Potential (Application)
7.2 Global Natural Soaps Market Sales by Application (2019-2025)
7.3 Global Natural Soaps Market Size (M USD) by Application (2019-2025)
7.4 Global Natural Soaps Sales Growth Rate by Application (2019-2025)
8 Natural Soaps Market Consumption by Region
8.1 Global Natural Soaps Sales by Region
8.1.1 Global Natural Soaps Sales by Region
8.1.2 Global Natural Soaps Sales Market Share by Region
8.2 North America
8.2.1 North America Natural Soaps Sales by Country
8.2.2 U.S.
8.2.3 Canada
8.2.4 Mexico
8.3 Europe
8.3.1 Europe Natural Soaps Sales by Country
8.3.2 Germany
8.3.3 France
8.3.4 U.K.
8.3.5 Italy
8.3.6 Russia
8.4 Asia Pacific
8.4.1 Asia Pacific Natural Soaps Sales by Region
8.4.2 China
8.4.3 Japan
8.4.4 South Korea
8.4.5 India
8.4.6 Southeast Asia
8.5 South America
8.5.1 South America Natural Soaps Sales by Country
8.5.2 Brazil
8.5.3 Argentina
8.5.4 Columbia
8.6 Middle East and Africa
8.6.1 Middle East and Africa Natural Soaps Sales by Region
8.6.2 Saudi Arabia
8.6.3 UAE
8.6.4 Egypt
8.6.5 Nigeria
8.6.6 South Africa
9 Natural Soaps Market Production by Region
9.1 Global Production of Natural Soaps by Region (2019-2025)
9.2 Global Natural Soaps Revenue Market Share by Region (2019-2025)
9.3 Global Natural Soaps Production, Revenue, Price and Gross Margin (2019-2025)
9.4 North America Natural Soaps Production
9.4.1 North America Natural Soaps Production Growth Rate (2019-2025)
9.4.2 North America Natural Soaps Production, Revenue, Price and Gross Margin (2019-2025)
9.5 Europe Natural Soaps Production
9.5.1 Europe Natural Soaps Production Growth Rate (2019-2025)
9.5.2 Europe Natural Soaps Production, Revenue, Price and Gross Margin (2019-2025)
9.6 Japan Natural Soaps Production (2019-2025)
9.6.1 Japan Natural Soaps Production Growth Rate (2019-2025)
9.6.2 Japan Natural Soaps Production, Revenue, Price and Gross Margin (2019-2025)
9.7 China Natural Soaps Production (2019-2025)
9.7.1 China Natural Soaps Production Growth Rate (2019-2025)
9.7.2 China Natural Soaps Production, Revenue, Price and Gross Margin (2019-2025)
10 Key Companies Profile
10.1 Sundial Brands LLC
10.1.1 Sundial Brands LLC Natural Soaps Basic Information
10.1.2 Sundial Brands LLC Natural Soaps Product Overview
10.1.3 Sundial Brands LLC Natural Soaps Product Market Performance
10.1.4 Sundial Brands LLC Business Overview
10.1.5 Sundial Brands LLC Natural Soaps SWOT Analysis
10.1.6 Sundial Brands LLC Recent Developments
10.2 EO Products
10.2.1 EO Products Natural Soaps Basic Information
10.2.2 EO Products Natural Soaps Product Overview
10.2.3 EO Products Natural Soaps Product Market Performance
10.2.4 EO Products Business Overview
10.2.5 EO Products Natural Soaps SWOT Analysis
10.2.6 EO Products Recent Developments
10.3 Vi-Tae
10.3.1 Vi-Tae Natural Soaps Basic Information
10.3.2 Vi-Tae Natural Soaps Product Overview
10.3.3 Vi-Tae Natural Soaps Product Market Performance
10.3.4 Vi-Tae Natural Soaps SWOT Analysis
10.3.5 Vi-Tae Business Overview
10.3.6 Vi-Tae Recent Developments
10.4 Pangea Organics
10.4.1 Pangea Organics Natural Soaps Basic Information
10.4.2 Pangea Organics Natural Soaps Product Overview
10.4.3 Pangea Organics Natural Soaps Product Market Performance
10.4.4 Pangea Organics Business Overview
10.4.5 Pangea Organics Recent Developments
10.5 All-One-God Faith
10.5.1 All-One-God Faith Natural Soaps Basic Information
10.5.2 All-One-God Faith Natural Soaps Product Overview
10.5.3 All-One-God Faith Natural Soaps Product Market Performance
10.5.4 All-One-God Faith Business Overview
10.5.5 All-One-God Faith Recent Developments
10.6 Neal's Yard (Natural Remedies) Limited
10.6.1 Neal's Yard (Natural Remedies) Limited Natural Soaps Basic Information
10.6.2 Neal's Yard (Natural Remedies) Limited Natural Soaps Product Overview
10.6.3 Neal's Yard (Natural Remedies) Limited Natural Soaps Product Market Performance
10.6.4 Neal's Yard (Natural Remedies) Limited Business Overview
10.6.5 Neal's Yard (Natural Remedies) Limited Recent Developments
10.7 Laverana GmbH and Co. KG
10.7.1 Laverana GmbH and Co. KG Natural Soaps Basic Information
10.7.2 Laverana GmbH and Co. KG Natural Soaps Product Overview
10.7.3 Laverana GmbH and Co. KG Natural Soaps Product Market Performance
10.7.4 Laverana GmbH and Co. KG Business Overview
10.7.5 Laverana GmbH and Co. KG Recent Developments
10.8 Truly's Natural Products
10.8.1 Truly's Natural Products Natural Soaps Basic Information
10.8.2 Truly's Natural Products Natural Soaps Product Overview
10.8.3 Truly's Natural Products Natural Soaps Product Market Performance
10.8.4 Truly's Natural Products Business Overview
10.8.5 Truly's Natural Products Recent Developments
10.9 Beach Organics
10.9.1 Beach Organics Natural Soaps Basic Information
10.9.2 Beach Organics Natural Soaps Product Overview
10.9.3 Beach Organics Natural Soaps Product Market Performance
10.9.4 Beach Organics Business Overview
10.9.5 Beach Organics Recent Developments
10.10 Nature's Gate
10.10.1 Nature's Gate Natural Soaps Basic Information
10.10.2 Nature's Gate Natural Soaps Product Overview
10.10.3 Nature's Gate Natural Soaps Product Market Performance
10.10.4 Nature's Gate Business Overview
10.10.5 Nature's Gate Recent Developments
10.11 Erbaviva
10.11.1 Erbaviva Natural Soaps Basic Information
10.11.2 Erbaviva Natural Soaps Product Overview
10.11.3 Erbaviva Natural Soaps Product Market Performance
10.11.4 Erbaviva Business Overview
10.11.5 Erbaviva Recent Developments
10.12 The Honest Company Inc
10.12.1 The Honest Company Inc Natural Soaps Basic Information
10.12.2 The Honest Company Inc Natural Soaps Product Overview
10.12.3 The Honest Company Inc Natural Soaps Product Market Performance
10.12.4 The Honest Company Inc Business Overview
10.12.5 The Honest Company Inc Recent Developments
10.13 Lavanila
10.13.1 Lavanila Natural Soaps Basic Information
10.13.2 Lavanila Natural Soaps Product Overview
10.13.3 Lavanila Natural Soaps Product Market Performance
10.13.4 Lavanila Business Overview
10.13.5 Lavanila Recent Developments
10.14 Sensible Organics
10.14.1 Sensible Organics Natural Soaps Basic Information
10.14.2 Sensible Organics Natural Soaps Product Overview
10.14.3 Sensible Organics Natural Soaps Product Market Performance
10.14.4 Sensible Organics Business Overview
10.14.5 Sensible Organics Recent Developments
10.15 Khadi Natural
10.15.1 Khadi Natural Natural Soaps Basic Information
10.15.2 Khadi Natural Natural Soaps Product Overview
10.15.3 Khadi Natural Natural Soaps Product Market Performance
10.15.4 Khadi Natural Business Overview
10.15.5 Khadi Natural Recent Developments
10.16 Forest Essentials
10.16.1 Forest Essentials Natural Soaps Basic Information
10.16.2 Forest Essentials Natural Soaps Product Overview
10.16.3 Forest Essentials Natural Soaps Product Market Performance
10.16.4 Forest Essentials Business Overview
10.16.5 Forest Essentials Recent Developments
10.17 Little Soap Company
10.17.1 Little Soap Company Natural Soaps Basic Information
10.17.2 Little Soap Company Natural Soaps Product Overview
10.17.3 Little Soap Company Natural Soaps Product Market Performance
10.17.4 Little Soap Company Business Overview
10.17.5 Little Soap Company Recent Developments
10.18 Chagrin Valley Soap and Salve Co
10.18.1 Chagrin Valley Soap and Salve Co Natural Soaps Basic Information
10.18.2 Chagrin Valley Soap and Salve Co Natural Soaps Product Overview
10.18.3 Chagrin Valley Soap and Salve Co Natural Soaps Product Market Performance
10.18.4 Chagrin Valley Soap and Salve Co Business Overview
10.18.5 Chagrin Valley Soap and Salve Co Recent Developments
10.19 Botanie Natural Soap Inc
10.19.1 Botanie Natural Soap Inc Natural Soaps Basic Information
10.19.2 Botanie Natural Soap Inc Natural Soaps Product Overview
10.19.3 Botanie Natural Soap Inc Natural Soaps Product Market Performance
10.19.4 Botanie Natural Soap Inc Business Overview
10.19.5 Botanie Natural Soap Inc Recent Developments
10.20 A Wild Bar Soap LLC
10.20.1 A Wild Bar Soap LLC Natural Soaps Basic Information
10.20.2 A Wild Bar Soap LLC Natural Soaps Product Overview
10.20.3 A Wild Bar Soap LLC Natural Soaps Product Market Performance
10.20.4 A Wild Bar Soap LLC Business Overview
10.20.5 A Wild Bar Soap LLC Recent Developments
11 Natural Soaps Market Forecast by Region
11.1 Global Natural Soaps Market Size Forecast
11.2 Global Natural Soaps Market Forecast by Region
11.2.1 North America Market Size Forecast by Country
11.2.2 Europe Natural Soaps Market Size Forecast by Country
11.2.3 Asia Pacific Natural Soaps Market Size Forecast by Region
11.2.4 South America Natural Soaps Market Size Forecast by Country
11.2.5 Middle East and Africa Forecasted Consumption of Natural Soaps by Country
12 Forecast Market by Type and by Application (2025-2032)
12.1 Global Natural Soaps Market Forecast by Type (2025-2032)
12.1.1 Global Forecasted Sales of Natural Soaps by Type (2025-2032)
12.1.2 Global Natural Soaps Market Size Forecast by Type (2025-2032)
12.1.3 Global Forecasted Price of Natural Soaps by Type (2025-2032)
12.2 Global Natural Soaps Market Forecast by Application (2025-2032)
12.2.1 Global Natural Soaps Sales (K Units) Forecast by Application
12.2.2 Global Natural Soaps Market Size (M USD) Forecast by Application (2025-2032)
13 Conclusion and Key Findings
LIST OF TABLES & FIGURES
List of Tables
Table 1. Introduction of the Type
Table 2. Introduction of the Application
Table 3. Market Size (M USD) Segment Executive Summary
Table 4. Natural Soaps Market Size Comparison by Region (M USD)
Table 5. Global Natural Soaps Sales (K Units) by Manufacturers (2019-2025)
Table 6. Global Natural Soaps Sales Market Share by Manufacturers (2019-2025)
Table 7. Global Natural Soaps Revenue (M USD) by Manufacturers (2019-2025)
Table 8. Global Natural Soaps Revenue Share by Manufacturers (2019-2025)
Table 9. Company Type (Tier 1, Tier 2, and Tier 3) & (based on the Revenue in Natural Soaps as of 2022)
Table 10. Global Market Natural Soaps Average Price (USD/Unit) of Key Manufacturers (2019-2025)
Table 11. Manufacturers Natural Soaps Sales Sites and Area Served
Table 12. Manufacturers Natural Soaps Product Type
Table 13. Global Natural Soaps Manufacturers Market Concentration Ratio (CR5 and HHI)
Table 14. Mergers & Acquisitions, Expansion Plans
Table 15. Industry Chain Map of Natural Soaps
Table 16. Market Overview of Key Raw Materials
Table 17. Midstream Market Analysis
Table 18. Downstream Customer Analysis
Table 19. Key Development Trends
Table 20. Driving Factors
Table 21. Natural Soaps Market Challenges
Table 22. Global Natural Soaps Sales by Type (K Units)
Table 23. Global Natural Soaps Market Size by Type (M USD)
Table 24. Global Natural Soaps Sales (K Units) by Type (2019-2025)
Table 25. Global Natural Soaps Sales Market Share by Type (2019-2025)
Table 26. Global Natural Soaps Market Size (M USD) by Type (2019-2025)
Table 27. Global Natural Soaps Market Size Share by Type (2019-2025)
Table 28. Global Natural Soaps Price (USD/Unit) by Type (2019-2025)
Table 29. Global Natural Soaps Sales (K Units) by Application
Table 30. Global Natural Soaps Market Size by Application
Table 31. Global Natural Soaps Sales by Application (2019-2025) & (K Units)
Table 32. Global Natural Soaps Sales Market Share by Application (2019-2025)
Table 33. Global Natural Soaps Sales by Application (2019-2025) & (M USD)
Table 34. Global Natural Soaps Market Share by Application (2019-2025)
Table 35. Global Natural Soaps Sales Growth Rate by Application (2019-2025)
Table 36. Global Natural Soaps Sales by Region (2019-2025) & (K Units)
Table 37. Global Natural Soaps Sales Market Share by Region (2019-2025)
Table 38. North America Natural Soaps Sales by Country (2019-2025) & (K Units)
Table 39. Europe Natural Soaps Sales by Country (2019-2025) & (K Units)
Table 40. Asia Pacific Natural Soaps Sales by Region (2019-2025) & (K Units)
Table 41. South America Natural Soaps Sales by Country (2019-2025) & (K Units)
Table 42. Middle East and Africa Natural Soaps Sales by Region (2019-2025) & (K Units)
Table 43. Global Natural Soaps Production (K Units) by Region (2019-2025)
Table 44. Global Natural Soaps Revenue (US$ Million) by Region (2019-2025)
Table 45. Global Natural Soaps Revenue Market Share by Region (2019-2025)
Table 46. Global Natural Soaps Production (K Units), Revenue (US$ Million), Price (USD/Unit) and Gross Margin (2019-2025)
Table 47. North America Natural Soaps Production (K Units), Revenue (US$ Million), Price (USD/Unit) and Gross Margin (2019-2025)
Table 48. Europe Natural Soaps Production (K Units), Revenue (US$ Million), Price (USD/Unit) and Gross Margin (2019-2025)
Table 49. Japan Natural Soaps Production (K Units), Revenue (US$ Million), Price (USD/Unit) and Gross Margin (2019-2025)
Table 50. China Natural Soaps Production (K Units), Revenue (US$ Million), Price (USD/Unit) and Gross Margin (2019-2025)
Table 51. Sundial Brands LLC Natural Soaps Basic Information
Table 52. Sundial Brands LLC Natural Soaps Product Overview
Table 53. Sundial Brands LLC Natural Soaps Sales (K Units), Revenue (M USD), Price (USD/Unit) and Gross Margin (2019-2025)
Table 54. Sundial Brands LLC Business Overview
Table 55. Sundial Brands LLC Natural Soaps SWOT Analysis
Table 56. Sundial Brands LLC Recent Developments
Table 57. EO Products Natural Soaps Basic Information
Table 58. EO Products Natural Soaps Product Overview
Table 59. EO Products Natural Soaps Sales (K Units), Revenue (M USD), Price (USD/Unit) and Gross Margin (2019-2025)
Table 60. EO Products Business Overview
Table 61. EO Products Natural Soaps SWOT Analysis
Table 62. EO Products Recent Developments
Table 63. Vi-Tae Natural Soaps Basic Information
Table 64. Vi-Tae Natural Soaps Product Overview
Table 65. Vi-Tae Natural Soaps Sales (K Units), Revenue (M USD), Price (USD/Unit) and Gross Margin (2019-2025)
Table 66. Vi-Tae Natural Soaps SWOT Analysis
Table 67. Vi-Tae Business Overview
Table 68. Vi-Tae Recent Developments
Table 69. Pangea Organics Natural Soaps Basic Information
Table 70. Pangea Organics Natural Soaps Product Overview
Table 71. Pangea Organics Natural Soaps Sales (K Units), Revenue (M USD), Price (USD/Unit) and Gross Margin (2019-2025)
Table 72. Pangea Organics Business Overview
Table 73. Pangea Organics Recent Developments
Table 74. All-One-God Faith Natural Soaps Basic Information
Table 75. All-One-God Faith Natural Soaps Product Overview
Table 76. All-One-God Faith Natural Soaps Sales (K Units), Revenue (M USD), Price (USD/Unit) and Gross Margin (2019-2025)
Table 77. All-One-God Faith Business Overview
Table 78. All-One-God Faith Recent Developments
Table 79. Neal's Yard (Natural Remedies) Limited Natural Soaps Basic Information
Table 80. Neal's Yard (Natural Remedies) Limited Natural Soaps Product Overview
Table 81. Neal's Yard (Natural Remedies) Limited Natural Soaps Sales (K Units), Revenue (M USD), Price (USD/Unit) and Gross Margin (2019-2025)
Table 82. Neal's Yard (Natural Remedies) Limited Business Overview
Table 83. Neal's Yard (Natural Remedies) Limited Recent Developments
Table 84. Laverana GmbH and Co. KG Natural Soaps Basic Information
Table 85. Laverana GmbH and Co. KG Natural Soaps Product Overview
Table 86. Laverana GmbH and Co. KG Natural Soaps Sales (K Units), Revenue (M USD), Price (USD/Unit) and Gross Margin (2019-2025)
Table 87. Laverana GmbH and Co. KG Business Overview
Table 88. Laverana GmbH and Co. KG Recent Developments
Table 89. Truly's Natural Products Natural Soaps Basic Information
Table 90. Truly's Natural Products Natural Soaps Product Overview
Table 91. Truly's Natural Products Natural Soaps Sales (K Units), Revenue (M USD), Price (USD/Unit) and Gross Margin (2019-2025)
Table 92. Truly's Natural Products Business Overview
Table 93. Truly's Natural Products Recent Developments
Table 94. Beach Organics Natural Soaps Basic Information
Table 95. Beach Organics Natural Soaps Product Overview
Table 96. Beach Organics Natural Soaps Sales (K Units), Revenue (M USD), Price (USD/Unit) and Gross Margin (2019-2025)
Table 97. Beach Organics Business Overview
Table 98. Beach Organics Recent Developments
Table 99. Nature's Gate Natural Soaps Basic Information
Table 100. Nature's Gate Natural Soaps Product Overview
Table 101. Nature's Gate Natural Soaps Sales (K Units), Revenue (M USD), Price (USD/Unit) and Gross Margin (2019-2025)
Table 102. Nature's Gate Business Overview
Table 103. Nature's Gate Recent Developments
Table 104. Erbaviva Natural Soaps Basic Information
Table 105. Erbaviva Natural Soaps Product Overview
Table 106. Erbaviva Natural Soaps Sales (K Units), Revenue (M USD), Price (USD/Unit) and Gross Margin (2019-2025)
Table 107. Erbaviva Business Overview
Table 108. Erbaviva Recent Developments
Table 109. The Honest Company Inc Natural Soaps Basic Information
Table 110. The Honest Company Inc Natural Soaps Product Overview
Table 111. The Honest Company Inc Natural Soaps Sales (K Units), Revenue (M USD), Price (USD/Unit) and Gross Margin (2019-2025)
Table 112. The Honest Company Inc Business Overview
Table 113. The Honest Company Inc Recent Developments
Table 114. Lavanila Natural Soaps Basic Information
Table 115. Lavanila Natural Soaps Product Overview
Table 116. Lavanila Natural Soaps Sales (K Units), Revenue (M USD), Price (USD/Unit) and Gross Margin (2019-2025)
Table 117. Lavanila Business Overview
Table 118. Lavanila Recent Developments
Table 119. Sensible Organics Natural Soaps Basic Information
Table 120. Sensible Organics Natural Soaps Product Overview
Table 121. Sensible Organics Natural Soaps Sales (K Units), Revenue (M USD), Price (USD/Unit) and Gross Margin (2019-2025)
Table 122. Sensible Organics Business Overview
Table 123. Sensible Organics Recent Developments
Table 124. Khadi Natural Natural Soaps Basic Information
Table 125. Khadi Natural Natural Soaps Product Overview
Table 126. Khadi Natural Natural Soaps Sales (K Units), Revenue (M USD), Price (USD/Unit) and Gross Margin (2019-2025)
Table 127. Khadi Natural Business Overview
Table 128. Khadi Natural Recent Developments
Table 129. Forest Essentials Natural Soaps Basic Information
Table 130. Forest Essentials Natural Soaps Product Overview
Table 131. Forest Essentials Natural Soaps Sales (K Units), Revenue (M USD), Price (USD/Unit) and Gross Margin (2019-2025)
Table 132. Forest Essentials Business Overview
Table 133. Forest Essentials Recent Developments
Table 134. Little Soap Company Natural Soaps Basic Information
Table 135. Little Soap Company Natural Soaps Product Overview
Table 136. Little Soap Company Natural Soaps Sales (K Units), Revenue (M USD), Price (USD/Unit) and Gross Margin (2019-2025)
Table 137. Little Soap Company Business Overview
Table 138. Little Soap Company Recent Developments
Table 139. Chagrin Valley Soap and Salve Co Natural Soaps Basic Information
Table 140. Chagrin Valley Soap and Salve Co Natural Soaps Product Overview
Table 141. Chagrin Valley Soap and Salve Co Natural Soaps Sales (K Units), Revenue (M USD), Price (USD/Unit) and Gross Margin (2019-2025)
Table 142. Chagrin Valley Soap and Salve Co Business Overview
Table 143. Chagrin Valley Soap and Salve Co Recent Developments
Table 144. Botanie Natural Soap Inc Natural Soaps Basic Information
Table 145. Botanie Natural Soap Inc Natural Soaps Product Overview
Table 146. Botanie Natural Soap Inc Natural Soaps Sales (K Units), Revenue (M USD), Price (USD/Unit) and Gross Margin (2019-2025)
Table 147. Botanie Natural Soap Inc Business Overview
Table 148. Botanie Natural Soap Inc Recent Developments
Table 149. A Wild Bar Soap LLC Natural Soaps Basic Information
Table 150. A Wild Bar Soap LLC Natural Soaps Product Overview
Table 151. A Wild Bar Soap LLC Natural Soaps Sales (K Units), Revenue (M USD), Price (USD/Unit) and Gross Margin (2019-2025)
Table 152. A Wild Bar Soap LLC Business Overview
Table 153. A Wild Bar Soap LLC Recent Developments
Table 154. Global Natural Soaps Sales Forecast by Region (2025-2032) & (K Units)
Table 155. Global Natural Soaps Market Size Forecast by Region (2025-2032) & (M USD)
Table 156. North America Natural Soaps Sales Forecast by Country (2025-2032) & (K Units)
Table 157. North America Natural Soaps Market Size Forecast by Country (2025-2032) & (M USD)
Table 158. Europe Natural Soaps Sales Forecast by Country (2025-2032) & (K Units)
Table 159. Europe Natural Soaps Market Size Forecast by Country (2025-2032) & (M USD)
Table 160. Asia Pacific Natural Soaps Sales Forecast by Region (2025-2032) & (K Units)
Table 161. Asia Pacific Natural Soaps Market Size Forecast by Region (2025-2032) & (M USD)
Table 162. South America Natural Soaps Sales Forecast by Country (2025-2032) & (K Units)
Table 163. South America Natural Soaps Market Size Forecast by Country (2025-2032) & (M USD)
Table 164. Middle East and Africa Natural Soaps Consumption Forecast by Country (2025-2032) & (Units)
Table 165. Middle East and Africa Natural Soaps Market Size Forecast by Country (2025-2032) & (M USD)
Table 166. Global Natural Soaps Sales Forecast by Type (2025-2032) & (K Units)
Table 167. Global Natural Soaps Market Size Forecast by Type (2025-2032) & (M USD)
Table 168. Global Natural Soaps Price Forecast by Type (2025-2032) & (USD/Unit)
Table 169. Global Natural Soaps Sales (K Units) Forecast by Application (2025-2032)
Table 170. Global Natural Soaps Market Size Forecast by Application (2025-2032) & (M USD)
List of Figures
Figure 1. Product Picture of Natural Soaps
Figure 2. Data Triangulation
Figure 3. Key Caveats
Figure 4. Global Natural Soaps Market Size (M USD), 2019-2032
Figure 5. Global Natural Soaps Market Size (M USD) (2019-2032)
Figure 6. Global Natural Soaps Sales (K Units) & (2019-2032)
Figure 7. Evaluation Matrix of Segment Market Development Potential (Type)
Figure 8. Evaluation Matrix of Segment Market Development Potential (Application)
Figure 9. Evaluation Matrix of Regional Market Development Potential
Figure 10. Natural Soaps Market Size by Country (M USD)
Figure 11. Natural Soaps Sales Share by Manufacturers in 2023
Figure 12. Global Natural Soaps Revenue Share by Manufacturers in 2023
Figure 13. Natural Soaps Market Share by Company Type (Tier 1, Tier 2 and Tier 3): 2023
Figure 14. Global Market Natural Soaps Average Price (USD/Unit) of Key Manufacturers in 2023
Figure 15. The Global 5 and 10 Largest Players: Market Share by Natural Soaps Revenue in 2023
Figure 16. Evaluation Matrix of Segment Market Development Potential (Type)
Figure 17. Global Natural Soaps Market Share by Type
Figure 18. Sales Market Share of Natural Soaps by Type (2019-2025)
Figure 19. Sales Market Share of Natural Soaps by Type in 2023
Figure 20. Market Size Share of Natural Soaps by Type (2019-2025)
Figure 21. Market Size Market Share of Natural Soaps by Type in 2023
Figure 22. Evaluation Matrix of Segment Market Development Potential (Application)
Figure 23. Global Natural Soaps Market Share by Application
Figure 24. Global Natural Soaps Sales Market Share by Application (2019-2025)
Figure 25. Global Natural Soaps Sales Market Share by Application in 2023
Figure 26. Global Natural Soaps Market Share by Application (2019-2025)
Figure 27. Global Natural Soaps Market Share by Application in 2023
Figure 28. Global Natural Soaps Sales Growth Rate by Application (2019-2025)
Figure 29. Global Natural Soaps Sales Market Share by Region (2019-2025)
Figure 30. North America Natural Soaps Sales and Growth Rate (2019-2025) & (K Units)
Figure 31. North America Natural Soaps Sales Market Share by Country in 2023
Figure 32. U.S. Natural Soaps Sales and Growth Rate (2019-2025) & (K Units)
Figure 33. Canada Natural Soaps Sales (K Units) and Growth Rate (2019-2025)
Figure 34. Mexico Natural Soaps Sales (Units) and Growth Rate (2019-2025)
Figure 35. Europe Natural Soaps Sales and Growth Rate (2019-2025) & (K Units)
Figure 36. Europe Natural Soaps Sales Market Share by Country in 2023
Figure 37. Germany Natural Soaps Sales and Growth Rate (2019-2025) & (K Units)
Figure 38. France Natural Soaps Sales and Growth Rate (2019-2025) & (K Units)
Figure 39. U.K. Natural Soaps Sales and Growth Rate (2019-2025) & (K Units)
Figure 40. Italy Natural Soaps Sales and Growth Rate (2019-2025) & (K Units)
Figure 41. Russia Natural Soaps Sales and Growth Rate (2019-2025) & (K Units)
Figure 42. Asia Pacific Natural Soaps Sales and Growth Rate (K Units)
Figure 43. Asia Pacific Natural Soaps Sales Market Share by Region in 2023
Figure 44. China Natural Soaps Sales and Growth Rate (2019-2025) & (K Units)
Figure 45. Japan Natural Soaps Sales and Growth Rate (2019-2025) & (K Units)
Figure 46. South Korea Natural Soaps Sales and Growth Rate (2019-2025) & (K Units)
Figure 47. India Natural Soaps Sales and Growth Rate (2019-2025) & (K Units)
Figure 48. Southeast Asia Natural Soaps Sales and Growth Rate (2019-2025) & (K Units)
Figure 49. South America Natural Soaps Sales and Growth Rate (K Units)
Figure 50. South America Natural Soaps Sales Market Share by Country in 2023
Figure 51. Brazil Natural Soaps Sales and Growth Rate (2019-2025) & (K Units)
Figure 52. Argentina Natural Soaps Sales and Growth Rate (2019-2025) & (K Units)
Figure 53. Columbia Natural Soaps Sales and Growth Rate (2019-2025) & (K Units)
Figure 54. Middle East and Africa Natural Soaps Sales and Growth Rate (K Units)
Figure 55. Middle East and Africa Natural Soaps Sales Market Share by Region in 2023
Figure 56. Saudi Arabia Natural Soaps Sales and Growth Rate (2019-2025) & (K Units)
Figure 57. UAE Natural Soaps Sales and Growth Rate (2019-2025) & (K Units)
Figure 58. Egypt Natural Soaps Sales and Growth Rate (2019-2025) & (K Units)
Figure 59. Nigeria Natural Soaps Sales and Growth Rate (2019-2025) & (K Units)
Figure 60. South Africa Natural Soaps Sales and Growth Rate (2019-2025) & (K Units)
Figure 61. Global Natural Soaps Production Market Share by Region (2019-2025)
Figure 62. North America Natural Soaps Production (K Units) Growth Rate (2019-2025)
Figure 63. Europe Natural Soaps Production (K Units) Growth Rate (2019-2025)
Figure 64. Japan Natural Soaps Production (K Units) Growth Rate (2019-2025)
Figure 65. China Natural Soaps Production (K Units) Growth Rate (2019-2025)
Figure 66. Global Natural Soaps Sales Forecast by Volume (2019-2032) & (K Units)
Figure 67. Global Natural Soaps Market Size Forecast by Value (2019-2032) & (M USD)
Figure 68. Global Natural Soaps Sales Market Share Forecast by Type (2025-2032)
Figure 69. Global Natural Soaps Market Share Forecast by Type (2025-2032)
Figure 70. Global Natural Soaps Sales Forecast by Application (2025-2032)
Figure 71. Global Natural Soaps Market Share Forecast by Application (2025-2032)

