Mobile Backend as a Service (MBaaS), also known as Backend as a Service (BaaS), is a cloud-based service model that enables developers to connect mobile and web applications with backend cloud storage, APIs, and various functionalities. These services include user authentication, push notifications, database management, cloud storage, and social media integrations, streamlining app development by reducing the need for backend coding. MBaaS is widely used in enterprise applications, consumer mobile apps, and IoT applications, facilitating seamless data connectivity and scalability.
Market Size
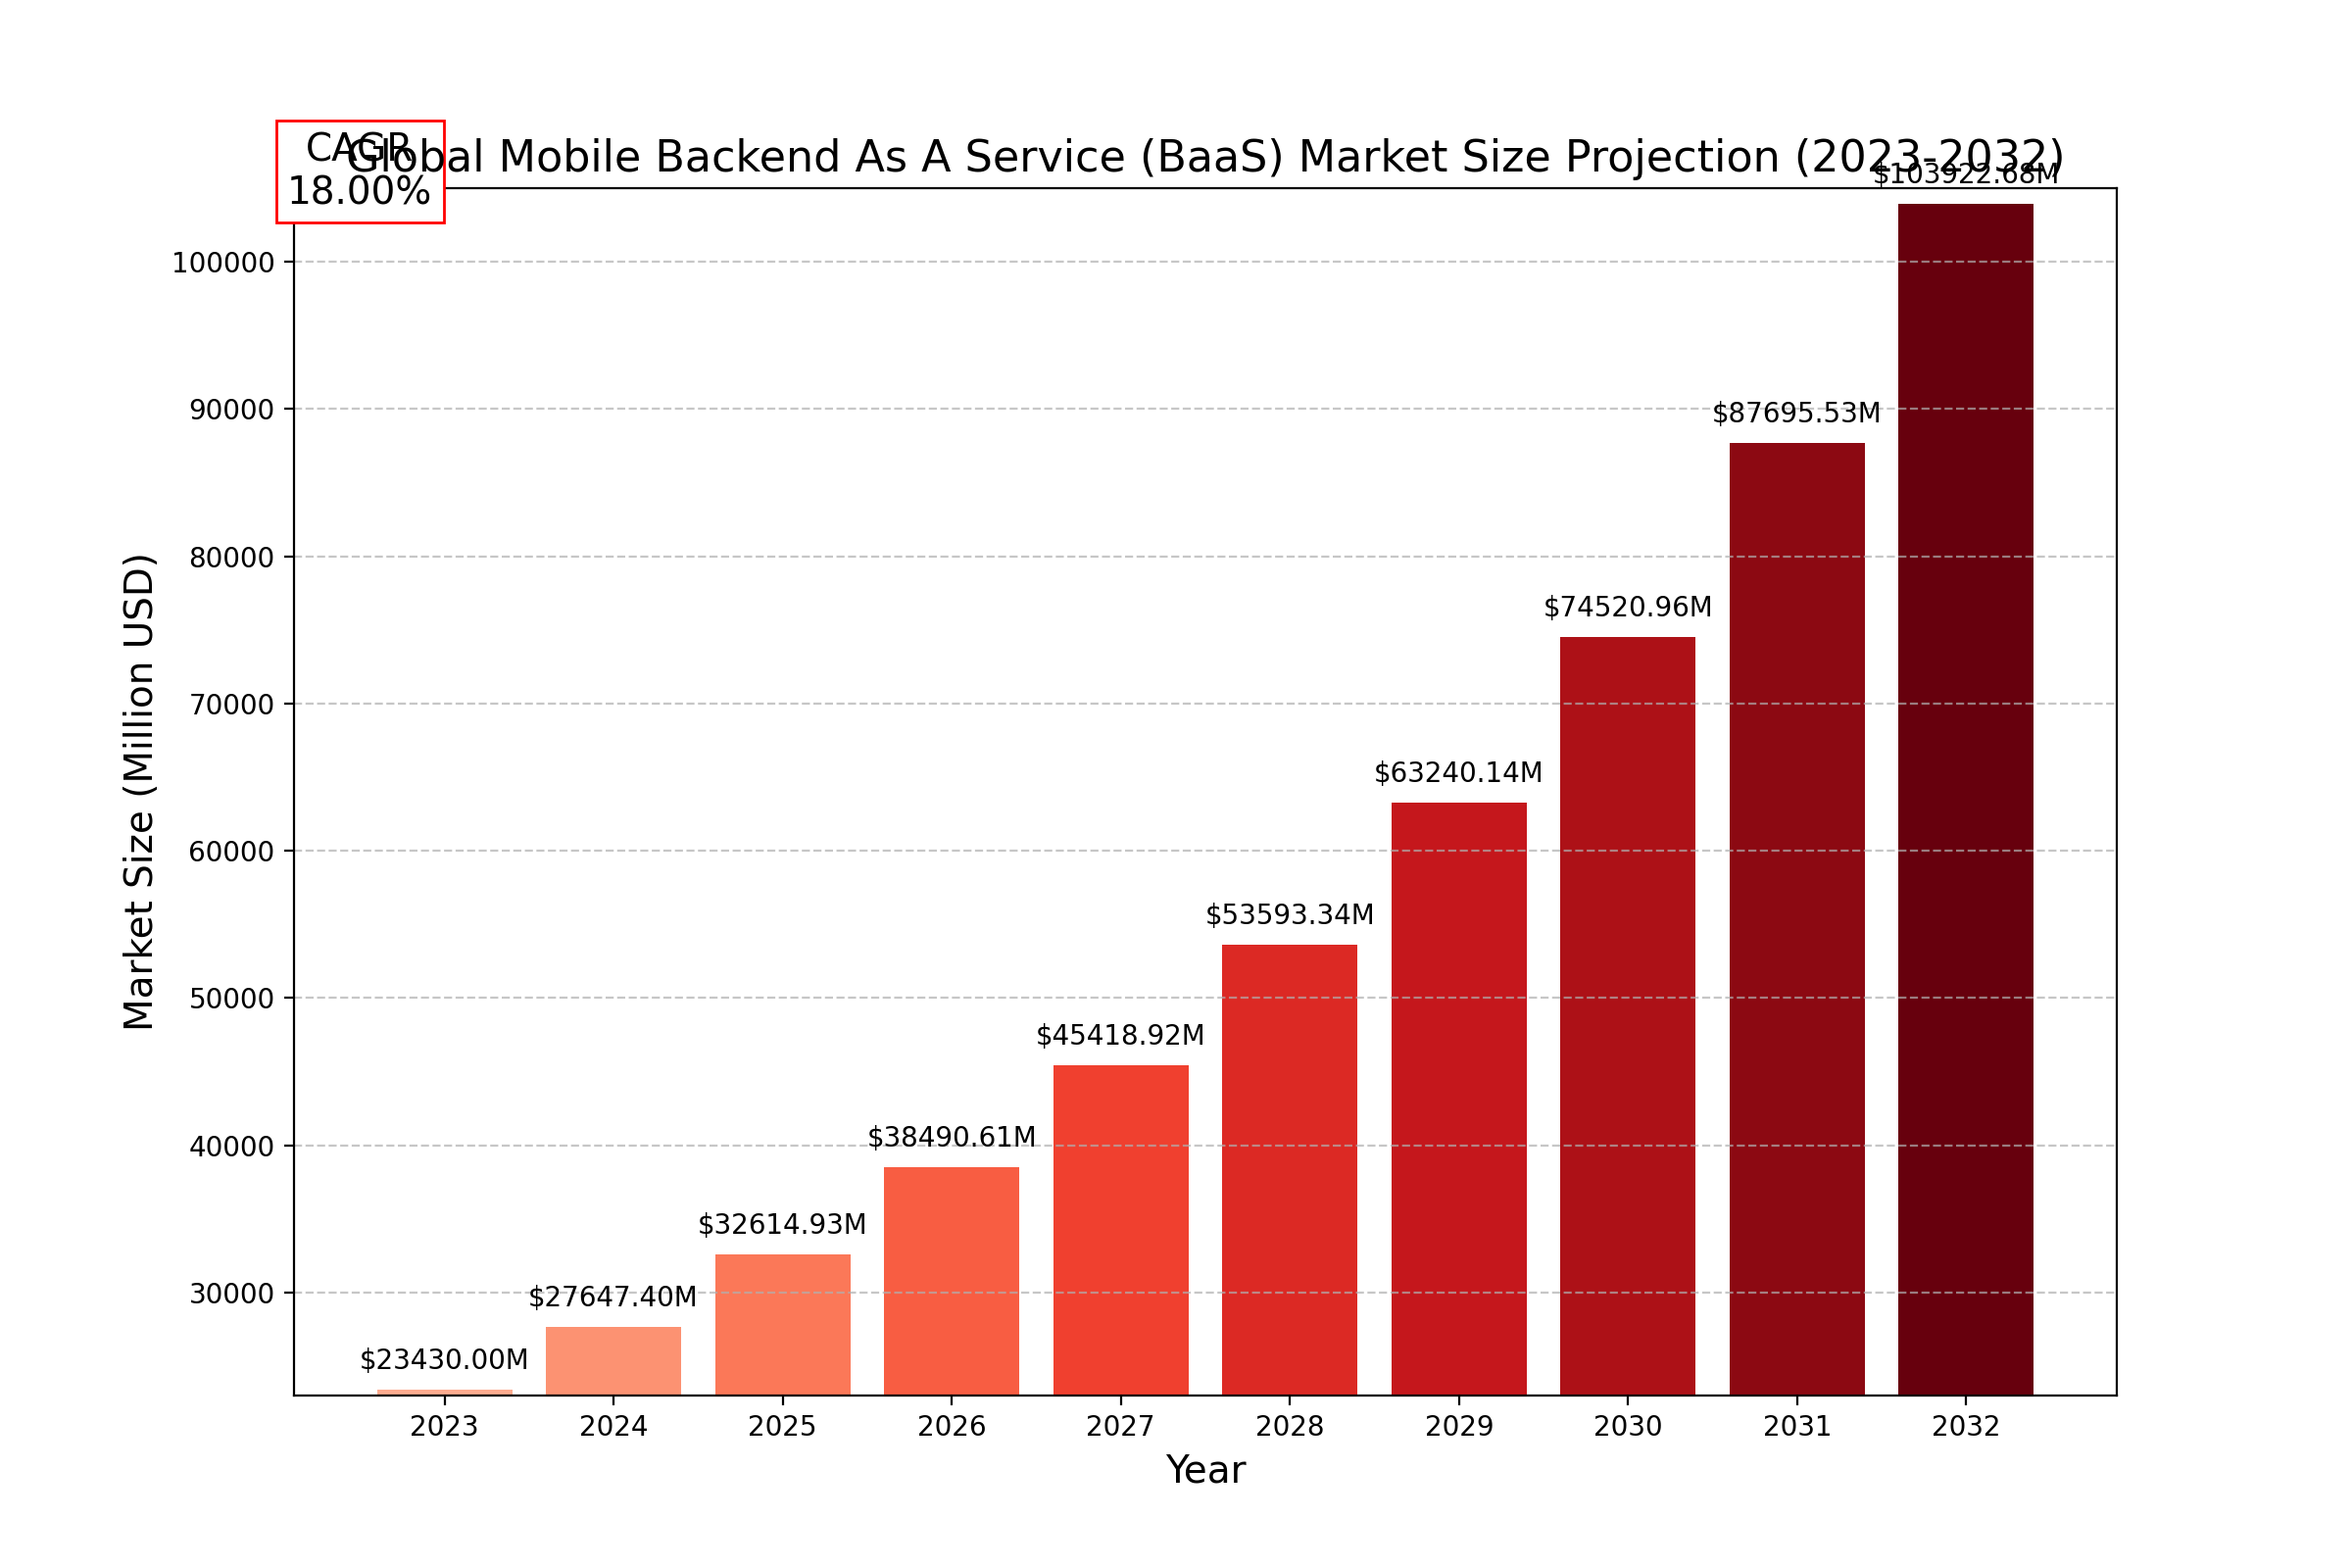
The global Mobile Backend As A Service (BaaS) market was valued at USD 23,430 million in 2023 and is expected to reach USD 103,922.68 million by 2032, growing at a CAGR of 18.00% during the forecast period.
North America dominated the market, with an estimated value of USD 8,134.40 million in 2023, growing at a CAGR of 15.43% from 2025 to 2032.
The increasing adoption of cloud-based applications, the rise in mobile app usage, and the growing demand for scalable backend solutions drive this market's expansion.
Market Dynamics (Drivers, Restraints, Opportunities, and Challenges)
Drivers
- Growing Mobile Application Market – The increasing number of mobile applications across industries fuels the demand for robust backend services.
- Rising Cloud Adoption – Organizations are shifting towards cloud computing for flexibility, scalability, and cost-effectiveness.
- Increasing Demand for Enterprise Applications – Businesses leverage MBaaS for customer engagement, data synchronization, and workflow automation.
- IoT and AI Integration – The emergence of IoT and AI-driven applications requires a scalable backend infrastructure, supporting MBaaS growth.
Restraints
- Security Concerns – Data security and privacy issues in cloud-based services pose challenges to MBaaS adoption.
- High Initial Costs – The cost of implementation and customization can be a barrier for small enterprises.
- Dependence on Third-Party Providers – Businesses relying on external MBaaS vendors face vendor lock-in risks and limited customization options.
Opportunities
- Expansion of 5G Networks – Faster connectivity will enhance cloud-based backend services, improving application performance.
- Emerging Markets Adoption – Developing countries are witnessing increased mobile penetration, creating new growth avenues.
- Advancements in API Development – API-first approaches and microservices architecture will boost MBaaS efficiency.
Challenges
- Integration Complexity – Businesses face challenges in integrating MBaaS solutions with existing IT infrastructure.
- Regulatory Compliance – Adhering to data protection regulations (e.g., GDPR, CCPA) increases operational complexities.
Regional Analysis
North America
North America leads the MBaaS market, driven by technological advancements, strong cloud infrastructure, and widespread adoption of mobile applications. The United States and Canada are key contributors, with major tech players such as IBM, Microsoft, and Oracle driving innovation.
Europe
Europe is witnessing steady MBaaS growth due to increasing enterprise digitalization and cloud computing adoption. Key markets include Germany, the UK, and France, with businesses leveraging MBaaS for automation and customer engagement.
Asia-Pacific
Asia-Pacific is the fastest-growing MBaaS market, fueled by China, India, and Japan. The region's increasing mobile user base and startup ecosystem drive MBaaS demand, with cloud adoption gaining momentum.
South America
South America, led by Brazil and Argentina, is gradually adopting MBaaS solutions, driven by digital transformation initiatives and mobile penetration.
Middle East & Africa
The Middle East and Africa (MEA) market is emerging, with Saudi Arabia, UAE, and South Africa investing in cloud technologies and mobile applications.
Competitor Analysis
The MBaaS market is highly competitive, with major players offering comprehensive backend solutions. Key companies include:
- Oracle Corporation – Provides cloud-based backend services with robust database management.
- IBM Corporation – Focuses on AI-integrated backend solutions for enterprises.
- Microsoft Corporation – Offers Azure-based MBaaS services with seamless integration options.
- Kony – Specializes in enterprise mobile applications with strong backend support.
- Kinvey – Provides developer-friendly BaaS platforms with scalable infrastructure.
- Anypresence – Known for custom MBaaS solutions catering to business needs.
- Appcelerator – Offers mobile backend services optimized for cross-platform development.
- Built.io – Provides cloud-based integration services for app developers.
- KII Corporation – Focuses on IoT and mobile application backends.
- Cloudmine – Delivers HIPAA-compliant backend services for healthcare applications.
- Parse – A popular backend service provider for mobile applications.
- Feedhenry – Specializes in cloud-based mobile backend solutions.
Market Segmentation (by Type)
- Android – The largest market segment due to the widespread adoption of Android mobile applications.
- iOS – Growing rapidly, driven by Apple's strong ecosystem and enterprise applications.
- Others – Includes cross-platform and emerging OS-based applications.
Market Segmentation (by Application)
- Data and Application Integration – Enabling seamless connectivity between applications and databases.
- Identity and Access Management – Ensuring secure user authentication and access control.
- Usage Analytics – Providing insights into app performance and user behavior.
- Support and Maintenance Service – Offering backend maintenance for uninterrupted app performance.
- Others – Includes additional MBaaS functionalities such as file storage and real-time databases.
Geographic Segmentation
- North America – USA, Canada, Mexico.
- Europe – Germany, UK, France, Russia, Italy, Rest of Europe.
- Asia-Pacific – China, Japan, South Korea, India, Southeast Asia, Rest of Asia-Pacific.
- South America – Brazil, Argentina, Colombia, Rest of South America.
- Middle East & Africa – Saudi Arabia, UAE, Egypt, Nigeria, South Africa, Rest of MEA.
FAQs
1. What is the current market size of the Mobile Backend As A Service (BaaS) market?
The global MBaaS market was valued at USD 23,430 million in 2023 and is projected to reach USD 103,922.68 million by 2032, growing at a CAGR of 18.00%.
2. Which are the key companies operating in the Mobile Backend As A Service (BaaS) market?
Major players include Oracle, IBM, Microsoft, Kony, Kinvey, Anypresence, Appcelerator, Built.io, KII Corporation, Cloudmine, Parse, and Feedhenry.
3. What are the key growth drivers in the Mobile Backend As A Service (BaaS) market?
Key drivers include the increasing demand for mobile applications, rising cloud adoption, enterprise digitalization, and IoT & AI integration.
4. Which regions dominate the Mobile Backend As A Service (BaaS) market?
North America is the leading market, followed by Europe and Asia-Pacific.
5. What are the emerging trends in the Mobile Backend As A Service (BaaS) market?
Trends include 5G adoption, API-first development, increased security measures, and growing demand for scalable backend solutions.
Key Benefits of This Market Research:
- Industry drivers, restraints, and opportunities covered in the study
- Neutral perspective on the market performance
- Recent industry trends and developments
- Competitive landscape & strategies of key players
- Potential & niche segments and regions exhibiting promising growth covered
- Historical, current, and projected market size, in terms of value
- In-depth analysis of the Mobile Backend As A Service (BaaS) Market
- Overview of the regional outlook of the Mobile Backend As A Service (BaaS) Market:
Key Reasons to Buy this Report:
- Access to date statistics compiled by our researchers. These provide you with historical and forecast data, which is analyzed to tell you why your market is set to change
- This enables you to anticipate market changes to remain ahead of your competitors
- You will be able to copy data from the Excel spreadsheet straight into your marketing plans, business presentations, or other strategic documents
- The concise analysis, clear graph, and table format will enable you to pinpoint the information you require quickly
- Provision of market value data for each segment and sub-segment
- Indicates the region and segment that is expected to witness the fastest growth as well as to dominate the market
- Analysis by geography highlighting the consumption of the product/service in the region as well as indicating the factors that are affecting the market within each region
- Competitive landscape which incorporates the market ranking of the major players, along with new service/product launches, partnerships, business expansions, and acquisitions in the past five years of companies profiled
- Extensive company profiles comprising of company overview, company insights, product benchmarking, and SWOT analysis for the major market players
- The current as well as the future market outlook of the industry concerning recent developments which involve growth opportunities and drivers as well as challenges and restraints of both emerging as well as developed regions
- Includes in-depth analysis of the market from various perspectives through Porter
TABLE OF CONTENTS
Table of Contents
1 Research Methodology and Statistical Scope
1.1 Market Definition and Statistical Scope of Mobile Backend As A Service (BaaS)
1.2 Key Market Segments
1.2.1 Mobile Backend As A Service (BaaS) Segment by Type
1.2.2 Mobile Backend As A Service (BaaS) Segment by Application
1.3 Methodology & Sources of Information
1.3.1 Research Methodology
1.3.2 Research Process
1.3.3 Market Breakdown and Data Triangulation
1.3.4 Base Year
1.3.5 Report Assumptions & Caveats
2 Mobile Backend As A Service (BaaS) Market Overview
2.1 Global Market Overview
2.1.1 Global Mobile Backend As A Service (BaaS) Market Size (M USD) Estimates and Forecasts (2019-2032)
2.1.2 Global Mobile Backend As A Service (BaaS) Sales Estimates and Forecasts (2019-2032)
2.2 Market Segment Executive Summary
2.3 Global Market Size by Region
3 Mobile Backend As A Service (BaaS) Market Competitive Landscape
3.1 Global Mobile Backend As A Service (BaaS) Sales by Manufacturers (2019-2025)
3.2 Global Mobile Backend As A Service (BaaS) Revenue Market Share by Manufacturers (2019-2025)
3.3 Mobile Backend As A Service (BaaS) Market Share by Company Type (Tier 1, Tier 2, and Tier 3)
3.4 Global Mobile Backend As A Service (BaaS) Average Price by Manufacturers (2019-2025)
3.5 Manufacturers Mobile Backend As A Service (BaaS) Sales Sites, Area Served, Product Type
3.6 Mobile Backend As A Service (BaaS) Market Competitive Situation and Trends
3.6.1 Mobile Backend As A Service (BaaS) Market Concentration Rate
3.6.2 Global 5 and 10 Largest Mobile Backend As A Service (BaaS) Players Market Share by Revenue
3.6.3 Mergers & Acquisitions, Expansion
4 Mobile Backend As A Service (BaaS) Industry Chain Analysis
4.1 Mobile Backend As A Service (BaaS) Industry Chain Analysis
4.2 Market Overview of Key Raw Materials
4.3 Midstream Market Analysis
4.4 Downstream Customer Analysis
5 The Development and Dynamics of Mobile Backend As A Service (BaaS) Market
5.1 Key Development Trends
5.2 Driving Factors
5.3 Market Challenges
5.4 Market Restraints
5.5 Industry News
5.5.1 New Product Developments
5.5.2 Mergers & Acquisitions
5.5.3 Expansions
5.5.4 Collaboration/Supply Contracts
5.6 Industry Policies
6 Mobile Backend As A Service (BaaS) Market Segmentation by Type
6.1 Evaluation Matrix of Segment Market Development Potential (Type)
6.2 Global Mobile Backend As A Service (BaaS) Sales Market Share by Type (2019-2025)
6.3 Global Mobile Backend As A Service (BaaS) Market Size Market Share by Type (2019-2025)
6.4 Global Mobile Backend As A Service (BaaS) Price by Type (2019-2025)
7 Mobile Backend As A Service (BaaS) Market Segmentation by Application
7.1 Evaluation Matrix of Segment Market Development Potential (Application)
7.2 Global Mobile Backend As A Service (BaaS) Market Sales by Application (2019-2025)
7.3 Global Mobile Backend As A Service (BaaS) Market Size (M USD) by Application (2019-2025)
7.4 Global Mobile Backend As A Service (BaaS) Sales Growth Rate by Application (2019-2025)
8 Mobile Backend As A Service (BaaS) Market Consumption by Region
8.1 Global Mobile Backend As A Service (BaaS) Sales by Region
8.1.1 Global Mobile Backend As A Service (BaaS) Sales by Region
8.1.2 Global Mobile Backend As A Service (BaaS) Sales Market Share by Region
8.2 North America
8.2.1 North America Mobile Backend As A Service (BaaS) Sales by Country
8.2.2 U.S.
8.2.3 Canada
8.2.4 Mexico
8.3 Europe
8.3.1 Europe Mobile Backend As A Service (BaaS) Sales by Country
8.3.2 Germany
8.3.3 France
8.3.4 U.K.
8.3.5 Italy
8.3.6 Russia
8.4 Asia Pacific
8.4.1 Asia Pacific Mobile Backend As A Service (BaaS) Sales by Region
8.4.2 China
8.4.3 Japan
8.4.4 South Korea
8.4.5 India
8.4.6 Southeast Asia
8.5 South America
8.5.1 South America Mobile Backend As A Service (BaaS) Sales by Country
8.5.2 Brazil
8.5.3 Argentina
8.5.4 Columbia
8.6 Middle East and Africa
8.6.1 Middle East and Africa Mobile Backend As A Service (BaaS) Sales by Region
8.6.2 Saudi Arabia
8.6.3 UAE
8.6.4 Egypt
8.6.5 Nigeria
8.6.6 South Africa
9 Mobile Backend As A Service (BaaS) Market Production by Region
9.1 Global Production of Mobile Backend As A Service (BaaS) by Region (2019-2025)
9.2 Global Mobile Backend As A Service (BaaS) Revenue Market Share by Region (2019-2025)
9.3 Global Mobile Backend As A Service (BaaS) Production, Revenue, Price and Gross Margin (2019-2025)
9.4 North America Mobile Backend As A Service (BaaS) Production
9.4.1 North America Mobile Backend As A Service (BaaS) Production Growth Rate (2019-2025)
9.4.2 North America Mobile Backend As A Service (BaaS) Production, Revenue, Price and Gross Margin (2019-2025)
9.5 Europe Mobile Backend As A Service (BaaS) Production
9.5.1 Europe Mobile Backend As A Service (BaaS) Production Growth Rate (2019-2025)
9.5.2 Europe Mobile Backend As A Service (BaaS) Production, Revenue, Price and Gross Margin (2019-2025)
9.6 Japan Mobile Backend As A Service (BaaS) Production (2019-2025)
9.6.1 Japan Mobile Backend As A Service (BaaS) Production Growth Rate (2019-2025)
9.6.2 Japan Mobile Backend As A Service (BaaS) Production, Revenue, Price and Gross Margin (2019-2025)
9.7 China Mobile Backend As A Service (BaaS) Production (2019-2025)
9.7.1 China Mobile Backend As A Service (BaaS) Production Growth Rate (2019-2025)
9.7.2 China Mobile Backend As A Service (BaaS) Production, Revenue, Price and Gross Margin (2019-2025)
10 Key Companies Profile
10.1 Oracle Corporation
10.1.1 Oracle Corporation Mobile Backend As A Service (BaaS) Basic Information
10.1.2 Oracle Corporation Mobile Backend As A Service (BaaS) Product Overview
10.1.3 Oracle Corporation Mobile Backend As A Service (BaaS) Product Market Performance
10.1.4 Oracle Corporation Business Overview
10.1.5 Oracle Corporation Mobile Backend As A Service (BaaS) SWOT Analysis
10.1.6 Oracle Corporation Recent Developments
10.2 IBM Corporation
10.2.1 IBM Corporation Mobile Backend As A Service (BaaS) Basic Information
10.2.2 IBM Corporation Mobile Backend As A Service (BaaS) Product Overview
10.2.3 IBM Corporation Mobile Backend As A Service (BaaS) Product Market Performance
10.2.4 IBM Corporation Business Overview
10.2.5 IBM Corporation Mobile Backend As A Service (BaaS) SWOT Analysis
10.2.6 IBM Corporation Recent Developments
10.3 Microsoft Corporation
10.3.1 Microsoft Corporation Mobile Backend As A Service (BaaS) Basic Information
10.3.2 Microsoft Corporation Mobile Backend As A Service (BaaS) Product Overview
10.3.3 Microsoft Corporation Mobile Backend As A Service (BaaS) Product Market Performance
10.3.4 Microsoft Corporation Mobile Backend As A Service (BaaS) SWOT Analysis
10.3.5 Microsoft Corporation Business Overview
10.3.6 Microsoft Corporation Recent Developments
10.4 Kony
10.4.1 Kony Mobile Backend As A Service (BaaS) Basic Information
10.4.2 Kony Mobile Backend As A Service (BaaS) Product Overview
10.4.3 Kony Mobile Backend As A Service (BaaS) Product Market Performance
10.4.4 Kony Business Overview
10.4.5 Kony Recent Developments
10.5 Kinvey
10.5.1 Kinvey Mobile Backend As A Service (BaaS) Basic Information
10.5.2 Kinvey Mobile Backend As A Service (BaaS) Product Overview
10.5.3 Kinvey Mobile Backend As A Service (BaaS) Product Market Performance
10.5.4 Kinvey Business Overview
10.5.5 Kinvey Recent Developments
10.6 Anypresence
10.6.1 Anypresence Mobile Backend As A Service (BaaS) Basic Information
10.6.2 Anypresence Mobile Backend As A Service (BaaS) Product Overview
10.6.3 Anypresence Mobile Backend As A Service (BaaS) Product Market Performance
10.6.4 Anypresence Business Overview
10.6.5 Anypresence Recent Developments
10.7 Appcelerator
10.7.1 Appcelerator Mobile Backend As A Service (BaaS) Basic Information
10.7.2 Appcelerator Mobile Backend As A Service (BaaS) Product Overview
10.7.3 Appcelerator Mobile Backend As A Service (BaaS) Product Market Performance
10.7.4 Appcelerator Business Overview
10.7.5 Appcelerator Recent Developments
10.8 Built.Io
10.8.1 Built.Io Mobile Backend As A Service (BaaS) Basic Information
10.8.2 Built.Io Mobile Backend As A Service (BaaS) Product Overview
10.8.3 Built.Io Mobile Backend As A Service (BaaS) Product Market Performance
10.8.4 Built.Io Business Overview
10.8.5 Built.Io Recent Developments
10.9 KII Corporation
10.9.1 KII Corporation Mobile Backend As A Service (BaaS) Basic Information
10.9.2 KII Corporation Mobile Backend As A Service (BaaS) Product Overview
10.9.3 KII Corporation Mobile Backend As A Service (BaaS) Product Market Performance
10.9.4 KII Corporation Business Overview
10.9.5 KII Corporation Recent Developments
10.10 Cloudmine
10.10.1 Cloudmine Mobile Backend As A Service (BaaS) Basic Information
10.10.2 Cloudmine Mobile Backend As A Service (BaaS) Product Overview
10.10.3 Cloudmine Mobile Backend As A Service (BaaS) Product Market Performance
10.10.4 Cloudmine Business Overview
10.10.5 Cloudmine Recent Developments
10.11 Parse
10.11.1 Parse Mobile Backend As A Service (BaaS) Basic Information
10.11.2 Parse Mobile Backend As A Service (BaaS) Product Overview
10.11.3 Parse Mobile Backend As A Service (BaaS) Product Market Performance
10.11.4 Parse Business Overview
10.11.5 Parse Recent Developments
10.12 Feedhenry
10.12.1 Feedhenry Mobile Backend As A Service (BaaS) Basic Information
10.12.2 Feedhenry Mobile Backend As A Service (BaaS) Product Overview
10.12.3 Feedhenry Mobile Backend As A Service (BaaS) Product Market Performance
10.12.4 Feedhenry Business Overview
10.12.5 Feedhenry Recent Developments
11 Mobile Backend As A Service (BaaS) Market Forecast by Region
11.1 Global Mobile Backend As A Service (BaaS) Market Size Forecast
11.2 Global Mobile Backend As A Service (BaaS) Market Forecast by Region
11.2.1 North America Market Size Forecast by Country
11.2.2 Europe Mobile Backend As A Service (BaaS) Market Size Forecast by Country
11.2.3 Asia Pacific Mobile Backend As A Service (BaaS) Market Size Forecast by Region
11.2.4 South America Mobile Backend As A Service (BaaS) Market Size Forecast by Country
11.2.5 Middle East and Africa Forecasted Consumption of Mobile Backend As A Service (BaaS) by Country
12 Forecast Market by Type and by Application (2025-2032)
12.1 Global Mobile Backend As A Service (BaaS) Market Forecast by Type (2025-2032)
12.1.1 Global Forecasted Sales of Mobile Backend As A Service (BaaS) by Type (2025-2032)
12.1.2 Global Mobile Backend As A Service (BaaS) Market Size Forecast by Type (2025-2032)
12.1.3 Global Forecasted Price of Mobile Backend As A Service (BaaS) by Type (2025-2032)
12.2 Global Mobile Backend As A Service (BaaS) Market Forecast by Application (2025-2032)
12.2.1 Global Mobile Backend As A Service (BaaS) Sales (K Units) Forecast by Application
12.2.2 Global Mobile Backend As A Service (BaaS) Market Size (M USD) Forecast by Application (2025-2032)
13 Conclusion and Key Findings
LIST OF TABLES & FIGURES
List of Tables
Table 1. Introduction of the Type
Table 2. Introduction of the Application
Table 3. Market Size (M USD) Segment Executive Summary
Table 4. Mobile Backend As A Service (BaaS) Market Size Comparison by Region (M USD)
Table 5. Global Mobile Backend As A Service (BaaS) Sales (K Units) by Manufacturers (2019-2025)
Table 6. Global Mobile Backend As A Service (BaaS) Sales Market Share by Manufacturers (2019-2025)
Table 7. Global Mobile Backend As A Service (BaaS) Revenue (M USD) by Manufacturers (2019-2025)
Table 8. Global Mobile Backend As A Service (BaaS) Revenue Share by Manufacturers (2019-2025)
Table 9. Company Type (Tier 1, Tier 2, and Tier 3) & (based on the Revenue in Mobile Backend As A Service (BaaS) as of 2022)
Table 10. Global Market Mobile Backend As A Service (BaaS) Average Price (USD/Unit) of Key Manufacturers (2019-2025)
Table 11. Manufacturers Mobile Backend As A Service (BaaS) Sales Sites and Area Served
Table 12. Manufacturers Mobile Backend As A Service (BaaS) Product Type
Table 13. Global Mobile Backend As A Service (BaaS) Manufacturers Market Concentration Ratio (CR5 and HHI)
Table 14. Mergers & Acquisitions, Expansion Plans
Table 15. Industry Chain Map of Mobile Backend As A Service (BaaS)
Table 16. Market Overview of Key Raw Materials
Table 17. Midstream Market Analysis
Table 18. Downstream Customer Analysis
Table 19. Key Development Trends
Table 20. Driving Factors
Table 21. Mobile Backend As A Service (BaaS) Market Challenges
Table 22. Global Mobile Backend As A Service (BaaS) Sales by Type (K Units)
Table 23. Global Mobile Backend As A Service (BaaS) Market Size by Type (M USD)
Table 24. Global Mobile Backend As A Service (BaaS) Sales (K Units) by Type (2019-2025)
Table 25. Global Mobile Backend As A Service (BaaS) Sales Market Share by Type (2019-2025)
Table 26. Global Mobile Backend As A Service (BaaS) Market Size (M USD) by Type (2019-2025)
Table 27. Global Mobile Backend As A Service (BaaS) Market Size Share by Type (2019-2025)
Table 28. Global Mobile Backend As A Service (BaaS) Price (USD/Unit) by Type (2019-2025)
Table 29. Global Mobile Backend As A Service (BaaS) Sales (K Units) by Application
Table 30. Global Mobile Backend As A Service (BaaS) Market Size by Application
Table 31. Global Mobile Backend As A Service (BaaS) Sales by Application (2019-2025) & (K Units)
Table 32. Global Mobile Backend As A Service (BaaS) Sales Market Share by Application (2019-2025)
Table 33. Global Mobile Backend As A Service (BaaS) Sales by Application (2019-2025) & (M USD)
Table 34. Global Mobile Backend As A Service (BaaS) Market Share by Application (2019-2025)
Table 35. Global Mobile Backend As A Service (BaaS) Sales Growth Rate by Application (2019-2025)
Table 36. Global Mobile Backend As A Service (BaaS) Sales by Region (2019-2025) & (K Units)
Table 37. Global Mobile Backend As A Service (BaaS) Sales Market Share by Region (2019-2025)
Table 38. North America Mobile Backend As A Service (BaaS) Sales by Country (2019-2025) & (K Units)
Table 39. Europe Mobile Backend As A Service (BaaS) Sales by Country (2019-2025) & (K Units)
Table 40. Asia Pacific Mobile Backend As A Service (BaaS) Sales by Region (2019-2025) & (K Units)
Table 41. South America Mobile Backend As A Service (BaaS) Sales by Country (2019-2025) & (K Units)
Table 42. Middle East and Africa Mobile Backend As A Service (BaaS) Sales by Region (2019-2025) & (K Units)
Table 43. Global Mobile Backend As A Service (BaaS) Production (K Units) by Region (2019-2025)
Table 44. Global Mobile Backend As A Service (BaaS) Revenue (US$ Million) by Region (2019-2025)
Table 45. Global Mobile Backend As A Service (BaaS) Revenue Market Share by Region (2019-2025)
Table 46. Global Mobile Backend As A Service (BaaS) Production (K Units), Revenue (US$ Million), Price (USD/Unit) and Gross Margin (2019-2025)
Table 47. North America Mobile Backend As A Service (BaaS) Production (K Units), Revenue (US$ Million), Price (USD/Unit) and Gross Margin (2019-2025)
Table 48. Europe Mobile Backend As A Service (BaaS) Production (K Units), Revenue (US$ Million), Price (USD/Unit) and Gross Margin (2019-2025)
Table 49. Japan Mobile Backend As A Service (BaaS) Production (K Units), Revenue (US$ Million), Price (USD/Unit) and Gross Margin (2019-2025)
Table 50. China Mobile Backend As A Service (BaaS) Production (K Units), Revenue (US$ Million), Price (USD/Unit) and Gross Margin (2019-2025)
Table 51. Oracle Corporation Mobile Backend As A Service (BaaS) Basic Information
Table 52. Oracle Corporation Mobile Backend As A Service (BaaS) Product Overview
Table 53. Oracle Corporation Mobile Backend As A Service (BaaS) Sales (K Units), Revenue (M USD), Price (USD/Unit) and Gross Margin (2019-2025)
Table 54. Oracle Corporation Business Overview
Table 55. Oracle Corporation Mobile Backend As A Service (BaaS) SWOT Analysis
Table 56. Oracle Corporation Recent Developments
Table 57. IBM Corporation Mobile Backend As A Service (BaaS) Basic Information
Table 58. IBM Corporation Mobile Backend As A Service (BaaS) Product Overview
Table 59. IBM Corporation Mobile Backend As A Service (BaaS) Sales (K Units), Revenue (M USD), Price (USD/Unit) and Gross Margin (2019-2025)
Table 60. IBM Corporation Business Overview
Table 61. IBM Corporation Mobile Backend As A Service (BaaS) SWOT Analysis
Table 62. IBM Corporation Recent Developments
Table 63. Microsoft Corporation Mobile Backend As A Service (BaaS) Basic Information
Table 64. Microsoft Corporation Mobile Backend As A Service (BaaS) Product Overview
Table 65. Microsoft Corporation Mobile Backend As A Service (BaaS) Sales (K Units), Revenue (M USD), Price (USD/Unit) and Gross Margin (2019-2025)
Table 66. Microsoft Corporation Mobile Backend As A Service (BaaS) SWOT Analysis
Table 67. Microsoft Corporation Business Overview
Table 68. Microsoft Corporation Recent Developments
Table 69. Kony Mobile Backend As A Service (BaaS) Basic Information
Table 70. Kony Mobile Backend As A Service (BaaS) Product Overview
Table 71. Kony Mobile Backend As A Service (BaaS) Sales (K Units), Revenue (M USD), Price (USD/Unit) and Gross Margin (2019-2025)
Table 72. Kony Business Overview
Table 73. Kony Recent Developments
Table 74. Kinvey Mobile Backend As A Service (BaaS) Basic Information
Table 75. Kinvey Mobile Backend As A Service (BaaS) Product Overview
Table 76. Kinvey Mobile Backend As A Service (BaaS) Sales (K Units), Revenue (M USD), Price (USD/Unit) and Gross Margin (2019-2025)
Table 77. Kinvey Business Overview
Table 78. Kinvey Recent Developments
Table 79. Anypresence Mobile Backend As A Service (BaaS) Basic Information
Table 80. Anypresence Mobile Backend As A Service (BaaS) Product Overview
Table 81. Anypresence Mobile Backend As A Service (BaaS) Sales (K Units), Revenue (M USD), Price (USD/Unit) and Gross Margin (2019-2025)
Table 82. Anypresence Business Overview
Table 83. Anypresence Recent Developments
Table 84. Appcelerator Mobile Backend As A Service (BaaS) Basic Information
Table 85. Appcelerator Mobile Backend As A Service (BaaS) Product Overview
Table 86. Appcelerator Mobile Backend As A Service (BaaS) Sales (K Units), Revenue (M USD), Price (USD/Unit) and Gross Margin (2019-2025)
Table 87. Appcelerator Business Overview
Table 88. Appcelerator Recent Developments
Table 89. Built.Io Mobile Backend As A Service (BaaS) Basic Information
Table 90. Built.Io Mobile Backend As A Service (BaaS) Product Overview
Table 91. Built.Io Mobile Backend As A Service (BaaS) Sales (K Units), Revenue (M USD), Price (USD/Unit) and Gross Margin (2019-2025)
Table 92. Built.Io Business Overview
Table 93. Built.Io Recent Developments
Table 94. KII Corporation Mobile Backend As A Service (BaaS) Basic Information
Table 95. KII Corporation Mobile Backend As A Service (BaaS) Product Overview
Table 96. KII Corporation Mobile Backend As A Service (BaaS) Sales (K Units), Revenue (M USD), Price (USD/Unit) and Gross Margin (2019-2025)
Table 97. KII Corporation Business Overview
Table 98. KII Corporation Recent Developments
Table 99. Cloudmine Mobile Backend As A Service (BaaS) Basic Information
Table 100. Cloudmine Mobile Backend As A Service (BaaS) Product Overview
Table 101. Cloudmine Mobile Backend As A Service (BaaS) Sales (K Units), Revenue (M USD), Price (USD/Unit) and Gross Margin (2019-2025)
Table 102. Cloudmine Business Overview
Table 103. Cloudmine Recent Developments
Table 104. Parse Mobile Backend As A Service (BaaS) Basic Information
Table 105. Parse Mobile Backend As A Service (BaaS) Product Overview
Table 106. Parse Mobile Backend As A Service (BaaS) Sales (K Units), Revenue (M USD), Price (USD/Unit) and Gross Margin (2019-2025)
Table 107. Parse Business Overview
Table 108. Parse Recent Developments
Table 109. Feedhenry Mobile Backend As A Service (BaaS) Basic Information
Table 110. Feedhenry Mobile Backend As A Service (BaaS) Product Overview
Table 111. Feedhenry Mobile Backend As A Service (BaaS) Sales (K Units), Revenue (M USD), Price (USD/Unit) and Gross Margin (2019-2025)
Table 112. Feedhenry Business Overview
Table 113. Feedhenry Recent Developments
Table 114. Global Mobile Backend As A Service (BaaS) Sales Forecast by Region (2025-2032) & (K Units)
Table 115. Global Mobile Backend As A Service (BaaS) Market Size Forecast by Region (2025-2032) & (M USD)
Table 116. North America Mobile Backend As A Service (BaaS) Sales Forecast by Country (2025-2032) & (K Units)
Table 117. North America Mobile Backend As A Service (BaaS) Market Size Forecast by Country (2025-2032) & (M USD)
Table 118. Europe Mobile Backend As A Service (BaaS) Sales Forecast by Country (2025-2032) & (K Units)
Table 119. Europe Mobile Backend As A Service (BaaS) Market Size Forecast by Country (2025-2032) & (M USD)
Table 120. Asia Pacific Mobile Backend As A Service (BaaS) Sales Forecast by Region (2025-2032) & (K Units)
Table 121. Asia Pacific Mobile Backend As A Service (BaaS) Market Size Forecast by Region (2025-2032) & (M USD)
Table 122. South America Mobile Backend As A Service (BaaS) Sales Forecast by Country (2025-2032) & (K Units)
Table 123. South America Mobile Backend As A Service (BaaS) Market Size Forecast by Country (2025-2032) & (M USD)
Table 124. Middle East and Africa Mobile Backend As A Service (BaaS) Consumption Forecast by Country (2025-2032) & (Units)
Table 125. Middle East and Africa Mobile Backend As A Service (BaaS) Market Size Forecast by Country (2025-2032) & (M USD)
Table 126. Global Mobile Backend As A Service (BaaS) Sales Forecast by Type (2025-2032) & (K Units)
Table 127. Global Mobile Backend As A Service (BaaS) Market Size Forecast by Type (2025-2032) & (M USD)
Table 128. Global Mobile Backend As A Service (BaaS) Price Forecast by Type (2025-2032) & (USD/Unit)
Table 129. Global Mobile Backend As A Service (BaaS) Sales (K Units) Forecast by Application (2025-2032)
Table 130. Global Mobile Backend As A Service (BaaS) Market Size Forecast by Application (2025-2032) & (M USD)
List of Figures
Figure 1. Product Picture of Mobile Backend As A Service (BaaS)
Figure 2. Data Triangulation
Figure 3. Key Caveats
Figure 4. Global Mobile Backend As A Service (BaaS) Market Size (M USD), 2019-2032
Figure 5. Global Mobile Backend As A Service (BaaS) Market Size (M USD) (2019-2032)
Figure 6. Global Mobile Backend As A Service (BaaS) Sales (K Units) & (2019-2032)
Figure 7. Evaluation Matrix of Segment Market Development Potential (Type)
Figure 8. Evaluation Matrix of Segment Market Development Potential (Application)
Figure 9. Evaluation Matrix of Regional Market Development Potential
Figure 10. Mobile Backend As A Service (BaaS) Market Size by Country (M USD)
Figure 11. Mobile Backend As A Service (BaaS) Sales Share by Manufacturers in 2023
Figure 12. Global Mobile Backend As A Service (BaaS) Revenue Share by Manufacturers in 2023
Figure 13. Mobile Backend As A Service (BaaS) Market Share by Company Type (Tier 1, Tier 2 and Tier 3): 2023
Figure 14. Global Market Mobile Backend As A Service (BaaS) Average Price (USD/Unit) of Key Manufacturers in 2023
Figure 15. The Global 5 and 10 Largest Players: Market Share by Mobile Backend As A Service (BaaS) Revenue in 2023
Figure 16. Evaluation Matrix of Segment Market Development Potential (Type)
Figure 17. Global Mobile Backend As A Service (BaaS) Market Share by Type
Figure 18. Sales Market Share of Mobile Backend As A Service (BaaS) by Type (2019-2025)
Figure 19. Sales Market Share of Mobile Backend As A Service (BaaS) by Type in 2023
Figure 20. Market Size Share of Mobile Backend As A Service (BaaS) by Type (2019-2025)
Figure 21. Market Size Market Share of Mobile Backend As A Service (BaaS) by Type in 2023
Figure 22. Evaluation Matrix of Segment Market Development Potential (Application)
Figure 23. Global Mobile Backend As A Service (BaaS) Market Share by Application
Figure 24. Global Mobile Backend As A Service (BaaS) Sales Market Share by Application (2019-2025)
Figure 25. Global Mobile Backend As A Service (BaaS) Sales Market Share by Application in 2023
Figure 26. Global Mobile Backend As A Service (BaaS) Market Share by Application (2019-2025)
Figure 27. Global Mobile Backend As A Service (BaaS) Market Share by Application in 2023
Figure 28. Global Mobile Backend As A Service (BaaS) Sales Growth Rate by Application (2019-2025)
Figure 29. Global Mobile Backend As A Service (BaaS) Sales Market Share by Region (2019-2025)
Figure 30. North America Mobile Backend As A Service (BaaS) Sales and Growth Rate (2019-2025) & (K Units)
Figure 31. North America Mobile Backend As A Service (BaaS) Sales Market Share by Country in 2023
Figure 32. U.S. Mobile Backend As A Service (BaaS) Sales and Growth Rate (2019-2025) & (K Units)
Figure 33. Canada Mobile Backend As A Service (BaaS) Sales (K Units) and Growth Rate (2019-2025)
Figure 34. Mexico Mobile Backend As A Service (BaaS) Sales (Units) and Growth Rate (2019-2025)
Figure 35. Europe Mobile Backend As A Service (BaaS) Sales and Growth Rate (2019-2025) & (K Units)
Figure 36. Europe Mobile Backend As A Service (BaaS) Sales Market Share by Country in 2023
Figure 37. Germany Mobile Backend As A Service (BaaS) Sales and Growth Rate (2019-2025) & (K Units)
Figure 38. France Mobile Backend As A Service (BaaS) Sales and Growth Rate (2019-2025) & (K Units)
Figure 39. U.K. Mobile Backend As A Service (BaaS) Sales and Growth Rate (2019-2025) & (K Units)
Figure 40. Italy Mobile Backend As A Service (BaaS) Sales and Growth Rate (2019-2025) & (K Units)
Figure 41. Russia Mobile Backend As A Service (BaaS) Sales and Growth Rate (2019-2025) & (K Units)
Figure 42. Asia Pacific Mobile Backend As A Service (BaaS) Sales and Growth Rate (K Units)
Figure 43. Asia Pacific Mobile Backend As A Service (BaaS) Sales Market Share by Region in 2023
Figure 44. China Mobile Backend As A Service (BaaS) Sales and Growth Rate (2019-2025) & (K Units)
Figure 45. Japan Mobile Backend As A Service (BaaS) Sales and Growth Rate (2019-2025) & (K Units)
Figure 46. South Korea Mobile Backend As A Service (BaaS) Sales and Growth Rate (2019-2025) & (K Units)
Figure 47. India Mobile Backend As A Service (BaaS) Sales and Growth Rate (2019-2025) & (K Units)
Figure 48. Southeast Asia Mobile Backend As A Service (BaaS) Sales and Growth Rate (2019-2025) & (K Units)
Figure 49. South America Mobile Backend As A Service (BaaS) Sales and Growth Rate (K Units)
Figure 50. South America Mobile Backend As A Service (BaaS) Sales Market Share by Country in 2023
Figure 51. Brazil Mobile Backend As A Service (BaaS) Sales and Growth Rate (2019-2025) & (K Units)
Figure 52. Argentina Mobile Backend As A Service (BaaS) Sales and Growth Rate (2019-2025) & (K Units)
Figure 53. Columbia Mobile Backend As A Service (BaaS) Sales and Growth Rate (2019-2025) & (K Units)
Figure 54. Middle East and Africa Mobile Backend As A Service (BaaS) Sales and Growth Rate (K Units)
Figure 55. Middle East and Africa Mobile Backend As A Service (BaaS) Sales Market Share by Region in 2023
Figure 56. Saudi Arabia Mobile Backend As A Service (BaaS) Sales and Growth Rate (2019-2025) & (K Units)
Figure 57. UAE Mobile Backend As A Service (BaaS) Sales and Growth Rate (2019-2025) & (K Units)
Figure 58. Egypt Mobile Backend As A Service (BaaS) Sales and Growth Rate (2019-2025) & (K Units)
Figure 59. Nigeria Mobile Backend As A Service (BaaS) Sales and Growth Rate (2019-2025) & (K Units)
Figure 60. South Africa Mobile Backend As A Service (BaaS) Sales and Growth Rate (2019-2025) & (K Units)
Figure 61. Global Mobile Backend As A Service (BaaS) Production Market Share by Region (2019-2025)
Figure 62. North America Mobile Backend As A Service (BaaS) Production (K Units) Growth Rate (2019-2025)
Figure 63. Europe Mobile Backend As A Service (BaaS) Production (K Units) Growth Rate (2019-2025)
Figure 64. Japan Mobile Backend As A Service (BaaS) Production (K Units) Growth Rate (2019-2025)
Figure 65. China Mobile Backend As A Service (BaaS) Production (K Units) Growth Rate (2019-2025)
Figure 66. Global Mobile Backend As A Service (BaaS) Sales Forecast by Volume (2019-2032) & (K Units)
Figure 67. Global Mobile Backend As A Service (BaaS) Market Size Forecast by Value (2019-2032) & (M USD)
Figure 68. Global Mobile Backend As A Service (BaaS) Sales Market Share Forecast by Type (2025-2032)
Figure 69. Global Mobile Backend As A Service (BaaS) Market Share Forecast by Type (2025-2032)
Figure 70. Global Mobile Backend As A Service (BaaS) Sales Forecast by Application (2025-2032)
Figure 71. Global Mobile Backend As A Service (BaaS) Market Share Forecast by Application (2025-2032)
 Market, Global Outlook and Forecast 2025-2032")
