The natural vitamins market refers to the global industry involved in the production, distribution, and consumption of vitamins sourced from natural ingredients. These vitamins are essential nutrients obtained from plant-based or animal-based sources, and they support a variety of bodily functions, including immune system function, energy production, and cellular repair. Natural vitamins differ from synthetic vitamins in that they are derived from whole food sources, ensuring higher bioavailability and absorption rates for the human body.
Key types of natural vitamins include Vitamin A, B, C, D, and E, each with unique roles in promoting health and wellness. Consumers are increasingly prioritizing natural vitamins over synthetic alternatives due to a growing awareness of the health benefits of organic and natural products.
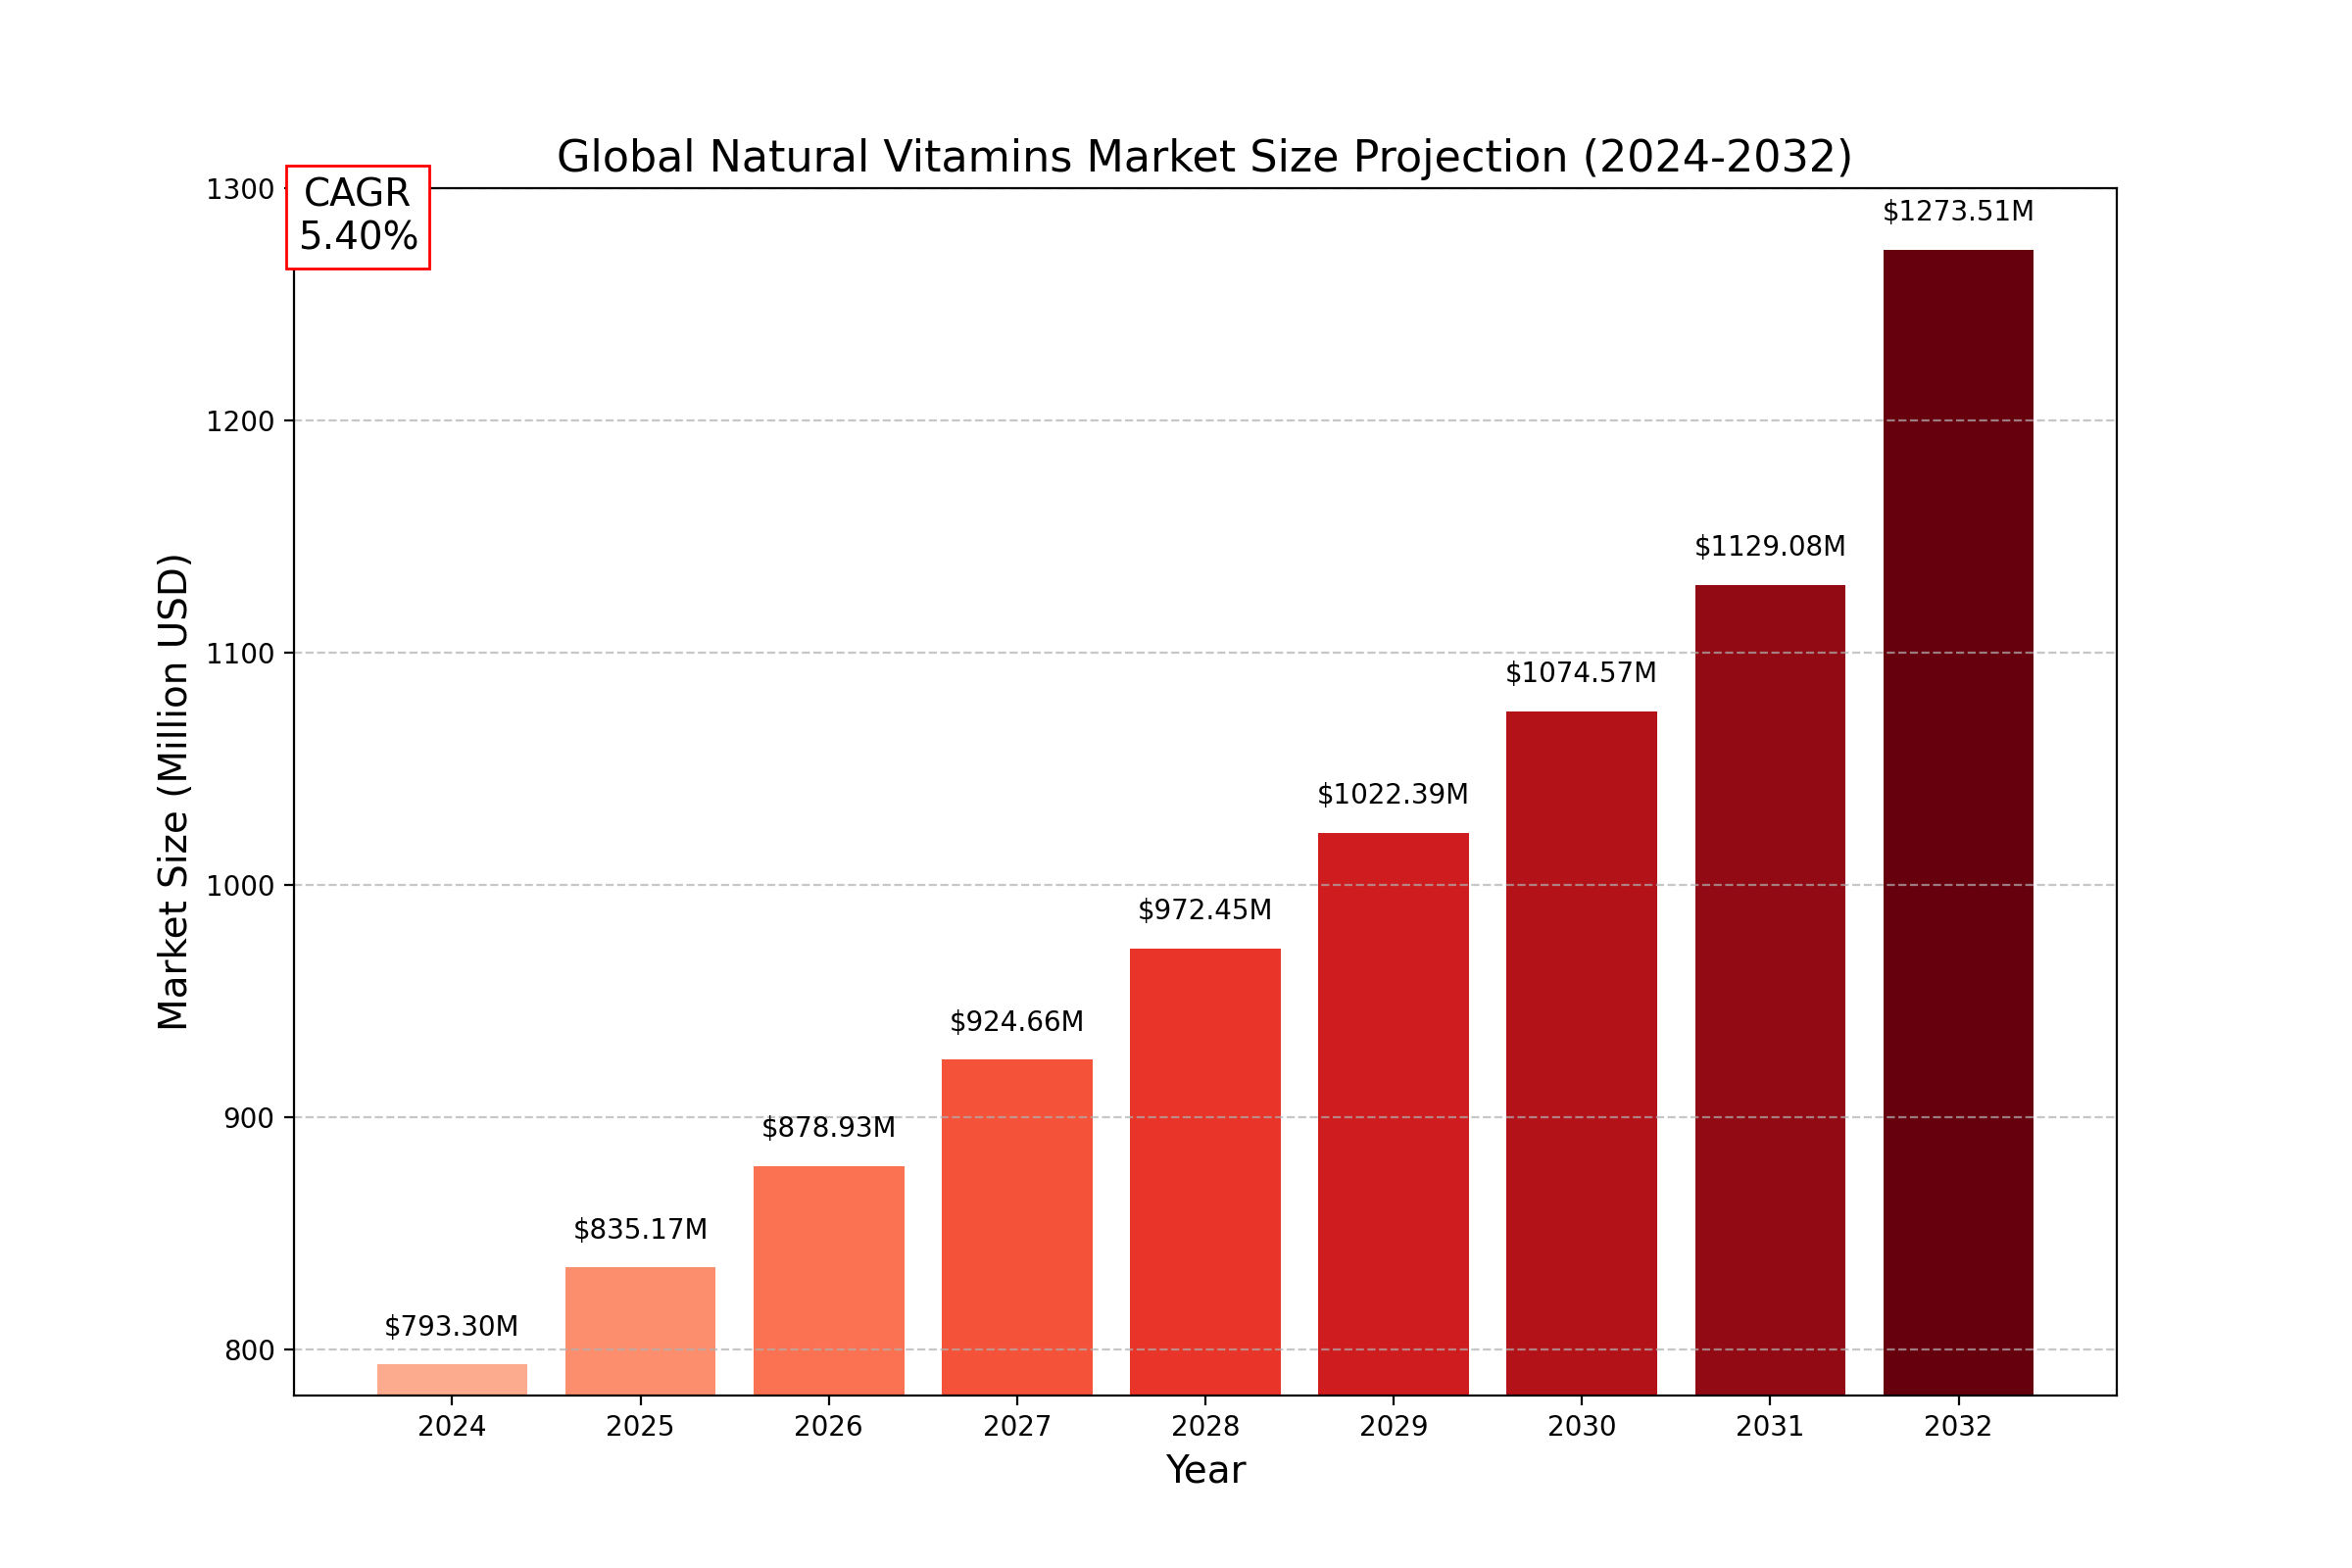
Market Size
The global natural vitamins market was valued at USD 793.30 million in 2024 and is expected to grow significantly over the next several years. By 2032, the market size is projected to reach USD 1,273.51 million, exhibiting a compound annual growth rate (CAGR) of 5.40% during the forecast period. This growth is driven by the increasing demand for natural and organic products, especially in regions where consumers are becoming more health-conscious and environmentally aware.
Growth Projections
Several factors are contributing to the upward trajectory of the natural vitamins market, including:
- Rising awareness about the benefits of natural health products.
- Increasing health-consciousness among consumers globally.
- The growing trend of self-care and preventive health.
- Expansion of the online retail market that makes natural vitamins more accessible.
This market expansion reflects the overall shift towards healthier and more sustainable consumption patterns, influenced by changing consumer preferences, technological innovations, and product advancements in the natural wellness sector.
Market Dynamics (Drivers, Restraints, Opportunities, and Challenges)
Drivers
-
Health Awareness: As consumers become more educated about the harmful effects of synthetic products, there has been a notable shift toward natural alternatives, particularly in health supplements and vitamins.
-
Rising Demand for Organic Products: The growing consumer preference for organic and chemical-free food products has significantly bolstered the demand for natural vitamins. Organic farming practices ensure the preservation of nutrients that are often lost in synthetic production methods.
-
Aging Population: An aging global population is becoming more inclined to use dietary supplements, including natural vitamins, to maintain health, manage chronic diseases, and improve quality of life.
-
Increasing Chronic Diseases: The rising incidence of chronic conditions, such as heart disease, diabetes, and obesity, has heightened the need for vitamins that support overall health, boosting demand for natural alternatives.
Restraints
-
High Cost of Natural Vitamins: Natural vitamins, often produced using organic or sustainably sourced ingredients, can be significantly more expensive than their synthetic counterparts. This may deter some price-sensitive consumers from opting for natural products.
-
Regulatory Challenges: The regulatory landscape for natural vitamins is not uniform across regions. Varying regulations concerning labeling, sourcing, and safety standards could hinder the market's growth in certain areas.
-
Limited Availability: In some regions, the availability of natural vitamins may be limited, particularly in developing countries with fewer established supply chains for organic and health-focused products.
Opportunities
-
Emerging Markets: Markets in regions such as Asia-Pacific, South America, and the Middle East are witnessing a surge in demand for health supplements, including natural vitamins. The increasing urbanization and income levels in these regions create vast growth potential.
-
Technological Advancements: The development of innovative and efficient extraction processes could reduce the cost of producing natural vitamins, thus making them more affordable and accessible to a broader market.
-
Customized Health Solutions: As consumers demand personalized health solutions, natural vitamin brands have the opportunity to cater to this need by offering tailored products to address individual nutritional requirements.
Challenges
-
Counterfeit Products: The natural vitamins market faces the challenge of counterfeit and substandard products, which can damage consumer trust and lead to negative market implications.
-
Sustainability Concerns: Despite the appeal of natural vitamins, the sourcing of raw materials can have environmental impacts, particularly when unsustainable practices are involved. Ensuring that products are sustainably sourced remains a challenge for many manufacturers.
Regional Analysis
The natural vitamins market shows varied growth trends across different regions, with North America, Europe, and Asia-Pacific being the major hubs for production and consumption.
North America
North America is one of the largest markets for natural vitamins, with the USA leading in both production and consumption. The growing interest in health and wellness, alongside the increasing popularity of preventive healthcare, supports the rise of natural vitamins in this region. The market size in North America was estimated at USD 226.29 million in 2024, and it is expected to grow at a CAGR of 4.63% from 2025 to 2032.
Europe
Europe also represents a mature and growing market for natural vitamins, with strong demand across countries like Germany, the UK, and France. There is a significant focus on organic products, driving the consumption of natural vitamins. Regulations in Europe tend to be stringent, ensuring high-quality standards for natural vitamin products.
Asia-Pacific
Asia-Pacific is expected to exhibit the highest growth rate during the forecast period due to rising incomes, an aging population, and an increasing shift toward health-conscious lifestyles. Countries like China, India, and Japan are contributing to the expansion of the natural vitamins market.
South America and Middle East & Africa
While smaller in comparison, the demand for natural vitamins in South America and the Middle East & Africa is on the rise. These regions are becoming more aware of the importance of natural health products, and demand is projected to increase steadily.
Competitor Analysis
Key Players in the Natural Vitamins Market
- Ddrops: Known for its high-quality liquid vitamin supplements, Ddrops focuses on innovation in product development.
- Bayer: A global leader in health and pharmaceuticals, Bayer offers a wide range of natural vitamins and supplements.
- Koninklijke DSM: This Dutch multinational is involved in the development of sustainable and effective natural vitamins.
- DuPont: DuPont’s offerings in the vitamins market are driven by their commitment to science-backed health solutions.
- Archer Daniels Midland (ADM): A key player in the global natural vitamins market, ADM provides a range of ingredients derived from natural sources.
- BASF: Known for its specialty ingredients, BASF’s natural vitamin products cater to a wide array of health needs.
Market Positioning
The key players compete on factors such as product innovation, sustainability, and distribution reach. Companies like Ddrops and Bayer lead in consumer recognition, while multinational giants like BASF and DuPont leverage their extensive supply chains and resources to drive growth.
Global Natural Vitamins Market: Market Segmentation Analysis
This report provides a deep insight into the global Natural Vitamins market, covering all its essential aspects. This ranges from a macro overview of the market to micro details of the market size, competitive landscape, development trend, niche market, key market drivers and challenges, SWOT analysis, value chain analysis, etc.
The analysis helps the reader to shape the competition within the industries and strategies for the competitive environment to enhance the potential profit. Furthermore, it provides a simple framework for evaluating and assessing the position of the business organization. The report structure also focuses on the competitive landscape of the Global Natural Vitamins Market. This report introduces in detail the market share, market performance, product situation, operation situation, etc., of the main players, which helps the readers in the industry to identify the main competitors and deeply understand the competition pattern of the market.
In a word, this report is a must-read for industry players, investors, researchers, consultants, business strategists, and all those who have any kind of stake or are planning to foray into the Natural Vitamins market in any manner.
Market Segmentation (by Application)
- Online Sales
- Offline Sales
Market Segmentation (by Type)
- Vitamin A
- Vitamin B
- Vitamin C
- Vitamin D
- Vitamin E
- Others
Key Company
- Ddrops
- Bayer
- Koninklijke DSM
- DuPont
- Archer Daniels Midland
- BASF
- Glanbia
- NutraMarks
- Otsuka Pharmaceutical
- Sanofi-aventis Healthcare
- Bioglan
Geographic Segmentation
- North America (USA, Canada, Mexico)
- Europe (Germany, UK, France, Russia, Italy, Rest of Europe)
- Asia-Pacific (China, Japan, South Korea, India, Southeast Asia, Rest of Asia-Pacific)
- South America (Brazil, Argentina, Columbia, Rest of South America)
- The Middle East and Africa (Saudi Arabia, UAE, Egypt, Nigeria, South Africa, Rest of MEA)
FAQ
What is the current market size of the Natural Vitamins Market?
- The global natural vitamins market is valued at USD 793.30 million in 2024 and is expected to grow to USD 1,273.51 million by 2032.
Which are the key companies operating in the Natural Vitamins Market?
- Key companies include Ddrops, Bayer, Koninklijke DSM, DuPont, Archer Daniels Midland, BASF, Glanbia, and more.
What are the key growth drivers in the Natural Vitamins Market?
- Drivers include increased health awareness, rising demand for organic products, aging populations, and a rise in chronic diseases.
Which regions dominate the Natural Vitamins Market?
- North America, Europe, and Asia-Pacific dominate the market, with North America holding the largest market share.
What are the emerging trends in the Natural Vitamins Market?
- Emerging trends include the growing demand for personalized health solutions and advancements in natural vitamin extraction technologies.
Key Benefits of This Market Research:
- Industry drivers, restraints, and opportunities covered in the study
- Neutral perspective on the market performance
- Recent industry trends and developments
- Competitive landscape & strategies of key players
- Potential & niche segments and regions exhibiting promising growth covered
- Historical, current, and projected market size, in terms of value
- In-depth analysis of the Natural Vitamins Market
- Overview of the regional outlook of the Natural Vitamins Market:
Key Reasons to Buy this Report:
- Access to date statistics compiled by our researchers. These provide you with historical and forecast data, which is analyzed to tell you why your market is set to change
- This enables you to anticipate market changes to remain ahead of your competitors
- You will be able to copy data from the Excel spreadsheet straight into your marketing plans, business presentations, or other strategic documents
- The concise analysis, clear graph, and table format will enable you to pinpoint the information you require quickly
- Provision of market value data for each segment and sub-segment
- Indicates the region and segment that is expected to witness the fastest growth as well as to dominate the market
- Analysis by geography highlighting the consumption of the product/service in the region as well as indicating the factors that are affecting the market within each region
- Competitive landscape which incorporates the market ranking of the major players, along with new service/product launches, partnerships, business expansions, and acquisitions in the past five years of companies profiled
- Extensive company profiles comprising of company overview, company insights, product benchmarking, and SWOT analysis for the major market players
- The current as well as the future market outlook of the industry concerning recent developments which involve growth opportunities and drivers as well as challenges and restraints of both emerging as well as developed regions
- Includes in-depth analysis of the market from various perspectives through Porter
TABLE OF CONTENTS
Table of Contents
1 Research Methodology and Statistical Scope
1.1 Market Definition and Statistical Scope of Natural Vitamins
1.2 Key Market Segments
1.2.1 Natural Vitamins Segment by Type
1.2.2 Natural Vitamins Segment by Application
1.3 Methodology & Sources of Information
1.3.1 Research Methodology
1.3.2 Research Process
1.3.3 Market Breakdown and Data Triangulation
1.3.4 Base Year
1.3.5 Report Assumptions & Caveats
2 Natural Vitamins Market Overview
2.1 Global Market Overview
2.1.1 Global Natural Vitamins Market Size (M USD) Estimates and Forecasts (2019-2032)
2.1.2 Global Natural Vitamins Sales Estimates and Forecasts (2019-2032)
2.2 Market Segment Executive Summary
2.3 Global Market Size by Region
3 Natural Vitamins Market Competitive Landscape
3.1 Global Natural Vitamins Sales by Manufacturers (2019-2025)
3.2 Global Natural Vitamins Revenue Market Share by Manufacturers (2019-2025)
3.3 Natural Vitamins Market Share by Company Type (Tier 1, Tier 2, and Tier 3)
3.4 Global Natural Vitamins Average Price by Manufacturers (2019-2025)
3.5 Manufacturers Natural Vitamins Sales Sites, Area Served, Product Type
3.6 Natural Vitamins Market Competitive Situation and Trends
3.6.1 Natural Vitamins Market Concentration Rate
3.6.2 Global 5 and 10 Largest Natural Vitamins Players Market Share by Revenue
3.6.3 Mergers & Acquisitions, Expansion
4 Natural Vitamins Industry Chain Analysis
4.1 Natural Vitamins Industry Chain Analysis
4.2 Market Overview of Key Raw Materials
4.3 Midstream Market Analysis
4.4 Downstream Customer Analysis
5 The Development and Dynamics of Natural Vitamins Market
5.1 Key Development Trends
5.2 Driving Factors
5.3 Market Challenges
5.4 Market Restraints
5.5 Industry News
5.5.1 New Product Developments
5.5.2 Mergers & Acquisitions
5.5.3 Expansions
5.5.4 Collaboration/Supply Contracts
5.6 Industry Policies
6 Natural Vitamins Market Segmentation by Type
6.1 Evaluation Matrix of Segment Market Development Potential (Type)
6.2 Global Natural Vitamins Sales Market Share by Type (2019-2025)
6.3 Global Natural Vitamins Market Size Market Share by Type (2019-2025)
6.4 Global Natural Vitamins Price by Type (2019-2025)
7 Natural Vitamins Market Segmentation by Application
7.1 Evaluation Matrix of Segment Market Development Potential (Application)
7.2 Global Natural Vitamins Market Sales by Application (2019-2025)
7.3 Global Natural Vitamins Market Size (M USD) by Application (2019-2025)
7.4 Global Natural Vitamins Sales Growth Rate by Application (2019-2025)
8 Natural Vitamins Market Consumption by Region
8.1 Global Natural Vitamins Sales by Region
8.1.1 Global Natural Vitamins Sales by Region
8.1.2 Global Natural Vitamins Sales Market Share by Region
8.2 North America
8.2.1 North America Natural Vitamins Sales by Country
8.2.2 U.S.
8.2.3 Canada
8.2.4 Mexico
8.3 Europe
8.3.1 Europe Natural Vitamins Sales by Country
8.3.2 Germany
8.3.3 France
8.3.4 U.K.
8.3.5 Italy
8.3.6 Russia
8.4 Asia Pacific
8.4.1 Asia Pacific Natural Vitamins Sales by Region
8.4.2 China
8.4.3 Japan
8.4.4 South Korea
8.4.5 India
8.4.6 Southeast Asia
8.5 South America
8.5.1 South America Natural Vitamins Sales by Country
8.5.2 Brazil
8.5.3 Argentina
8.5.4 Columbia
8.6 Middle East and Africa
8.6.1 Middle East and Africa Natural Vitamins Sales by Region
8.6.2 Saudi Arabia
8.6.3 UAE
8.6.4 Egypt
8.6.5 Nigeria
8.6.6 South Africa
9 Natural Vitamins Market Production by Region
9.1 Global Production of Natural Vitamins by Region (2019-2025)
9.2 Global Natural Vitamins Revenue Market Share by Region (2019-2025)
9.3 Global Natural Vitamins Production, Revenue, Price and Gross Margin (2019-2025)
9.4 North America Natural Vitamins Production
9.4.1 North America Natural Vitamins Production Growth Rate (2019-2025)
9.4.2 North America Natural Vitamins Production, Revenue, Price and Gross Margin (2019-2025)
9.5 Europe Natural Vitamins Production
9.5.1 Europe Natural Vitamins Production Growth Rate (2019-2025)
9.5.2 Europe Natural Vitamins Production, Revenue, Price and Gross Margin (2019-2025)
9.6 Japan Natural Vitamins Production (2019-2025)
9.6.1 Japan Natural Vitamins Production Growth Rate (2019-2025)
9.6.2 Japan Natural Vitamins Production, Revenue, Price and Gross Margin (2019-2025)
9.7 China Natural Vitamins Production (2019-2025)
9.7.1 China Natural Vitamins Production Growth Rate (2019-2025)
9.7.2 China Natural Vitamins Production, Revenue, Price and Gross Margin (2019-2025)
10 Key Companies Profile
10.1 Ddrops
10.1.1 Ddrops Natural Vitamins Basic Information
10.1.2 Ddrops Natural Vitamins Product Overview
10.1.3 Ddrops Natural Vitamins Product Market Performance
10.1.4 Ddrops Business Overview
10.1.5 Ddrops Natural Vitamins SWOT Analysis
10.1.6 Ddrops Recent Developments
10.2 Bayer
10.2.1 Bayer Natural Vitamins Basic Information
10.2.2 Bayer Natural Vitamins Product Overview
10.2.3 Bayer Natural Vitamins Product Market Performance
10.2.4 Bayer Business Overview
10.2.5 Bayer Natural Vitamins SWOT Analysis
10.2.6 Bayer Recent Developments
10.3 Koninklijke DSM
10.3.1 Koninklijke DSM Natural Vitamins Basic Information
10.3.2 Koninklijke DSM Natural Vitamins Product Overview
10.3.3 Koninklijke DSM Natural Vitamins Product Market Performance
10.3.4 Koninklijke DSM Natural Vitamins SWOT Analysis
10.3.5 Koninklijke DSM Business Overview
10.3.6 Koninklijke DSM Recent Developments
10.4 DuPont
10.4.1 DuPont Natural Vitamins Basic Information
10.4.2 DuPont Natural Vitamins Product Overview
10.4.3 DuPont Natural Vitamins Product Market Performance
10.4.4 DuPont Business Overview
10.4.5 DuPont Recent Developments
10.5 Archer Daniels Midland
10.5.1 Archer Daniels Midland Natural Vitamins Basic Information
10.5.2 Archer Daniels Midland Natural Vitamins Product Overview
10.5.3 Archer Daniels Midland Natural Vitamins Product Market Performance
10.5.4 Archer Daniels Midland Business Overview
10.5.5 Archer Daniels Midland Recent Developments
10.6 BASF
10.6.1 BASF Natural Vitamins Basic Information
10.6.2 BASF Natural Vitamins Product Overview
10.6.3 BASF Natural Vitamins Product Market Performance
10.6.4 BASF Business Overview
10.6.5 BASF Recent Developments
10.7 Glanbia
10.7.1 Glanbia Natural Vitamins Basic Information
10.7.2 Glanbia Natural Vitamins Product Overview
10.7.3 Glanbia Natural Vitamins Product Market Performance
10.7.4 Glanbia Business Overview
10.7.5 Glanbia Recent Developments
10.8 NutraMarks
10.8.1 NutraMarks Natural Vitamins Basic Information
10.8.2 NutraMarks Natural Vitamins Product Overview
10.8.3 NutraMarks Natural Vitamins Product Market Performance
10.8.4 NutraMarks Business Overview
10.8.5 NutraMarks Recent Developments
10.9 Otsuka Pharmaceutical
10.9.1 Otsuka Pharmaceutical Natural Vitamins Basic Information
10.9.2 Otsuka Pharmaceutical Natural Vitamins Product Overview
10.9.3 Otsuka Pharmaceutical Natural Vitamins Product Market Performance
10.9.4 Otsuka Pharmaceutical Business Overview
10.9.5 Otsuka Pharmaceutical Recent Developments
10.10 Sanofi-aventis Healthcare
10.10.1 Sanofi-aventis Healthcare Natural Vitamins Basic Information
10.10.2 Sanofi-aventis Healthcare Natural Vitamins Product Overview
10.10.3 Sanofi-aventis Healthcare Natural Vitamins Product Market Performance
10.10.4 Sanofi-aventis Healthcare Business Overview
10.10.5 Sanofi-aventis Healthcare Recent Developments
10.11 Bioglan
10.11.1 Bioglan Natural Vitamins Basic Information
10.11.2 Bioglan Natural Vitamins Product Overview
10.11.3 Bioglan Natural Vitamins Product Market Performance
10.11.4 Bioglan Business Overview
10.11.5 Bioglan Recent Developments
11 Natural Vitamins Market Forecast by Region
11.1 Global Natural Vitamins Market Size Forecast
11.2 Global Natural Vitamins Market Forecast by Region
11.2.1 North America Market Size Forecast by Country
11.2.2 Europe Natural Vitamins Market Size Forecast by Country
11.2.3 Asia Pacific Natural Vitamins Market Size Forecast by Region
11.2.4 South America Natural Vitamins Market Size Forecast by Country
11.2.5 Middle East and Africa Forecasted Consumption of Natural Vitamins by Country
12 Forecast Market by Type and by Application (2025-2032)
12.1 Global Natural Vitamins Market Forecast by Type (2025-2032)
12.1.1 Global Forecasted Sales of Natural Vitamins by Type (2025-2032)
12.1.2 Global Natural Vitamins Market Size Forecast by Type (2025-2032)
12.1.3 Global Forecasted Price of Natural Vitamins by Type (2025-2032)
12.2 Global Natural Vitamins Market Forecast by Application (2025-2032)
12.2.1 Global Natural Vitamins Sales (K MT) Forecast by Application
12.2.2 Global Natural Vitamins Market Size (M USD) Forecast by Application (2025-2032)
13 Conclusion and Key Findings
LIST OF TABLES & FIGURES
List of Tables
Table 1. Introduction of the Type
Table 2. Introduction of the Application
Table 3. Market Size (M USD) Segment Executive Summary
Table 4. Natural Vitamins Market Size Comparison by Region (M USD)
Table 5. Global Natural Vitamins Sales (K MT) by Manufacturers (2019-2025)
Table 6. Global Natural Vitamins Sales Market Share by Manufacturers (2019-2025)
Table 7. Global Natural Vitamins Revenue (M USD) by Manufacturers (2019-2025)
Table 8. Global Natural Vitamins Revenue Share by Manufacturers (2019-2025)
Table 9. Company Type (Tier 1, Tier 2, and Tier 3) & (based on the Revenue in Natural Vitamins as of 2022)
Table 10. Global Market Natural Vitamins Average Price (USD/MT) of Key Manufacturers (2019-2025)
Table 11. Manufacturers Natural Vitamins Sales Sites and Area Served
Table 12. Manufacturers Natural Vitamins Product Type
Table 13. Global Natural Vitamins Manufacturers Market Concentration Ratio (CR5 and HHI)
Table 14. Mergers & Acquisitions, Expansion Plans
Table 15. Industry Chain Map of Natural Vitamins
Table 16. Market Overview of Key Raw Materials
Table 17. Midstream Market Analysis
Table 18. Downstream Customer Analysis
Table 19. Key Development Trends
Table 20. Driving Factors
Table 21. Natural Vitamins Market Challenges
Table 22. Global Natural Vitamins Sales by Type (K MT)
Table 23. Global Natural Vitamins Market Size by Type (M USD)
Table 24. Global Natural Vitamins Sales (K MT) by Type (2019-2025)
Table 25. Global Natural Vitamins Sales Market Share by Type (2019-2025)
Table 26. Global Natural Vitamins Market Size (M USD) by Type (2019-2025)
Table 27. Global Natural Vitamins Market Size Share by Type (2019-2025)
Table 28. Global Natural Vitamins Price (USD/MT) by Type (2019-2025)
Table 29. Global Natural Vitamins Sales (K MT) by Application
Table 30. Global Natural Vitamins Market Size by Application
Table 31. Global Natural Vitamins Sales by Application (2019-2025) & (K MT)
Table 32. Global Natural Vitamins Sales Market Share by Application (2019-2025)
Table 33. Global Natural Vitamins Sales by Application (2019-2025) & (M USD)
Table 34. Global Natural Vitamins Market Share by Application (2019-2025)
Table 35. Global Natural Vitamins Sales Growth Rate by Application (2019-2025)
Table 36. Global Natural Vitamins Sales by Region (2019-2025) & (K MT)
Table 37. Global Natural Vitamins Sales Market Share by Region (2019-2025)
Table 38. North America Natural Vitamins Sales by Country (2019-2025) & (K MT)
Table 39. Europe Natural Vitamins Sales by Country (2019-2025) & (K MT)
Table 40. Asia Pacific Natural Vitamins Sales by Region (2019-2025) & (K MT)
Table 41. South America Natural Vitamins Sales by Country (2019-2025) & (K MT)
Table 42. Middle East and Africa Natural Vitamins Sales by Region (2019-2025) & (K MT)
Table 43. Global Natural Vitamins Production (K MT) by Region (2019-2025)
Table 44. Global Natural Vitamins Revenue (US$ Million) by Region (2019-2025)
Table 45. Global Natural Vitamins Revenue Market Share by Region (2019-2025)
Table 46. Global Natural Vitamins Production (K MT), Revenue (US$ Million), Price (USD/MT) and Gross Margin (2019-2025)
Table 47. North America Natural Vitamins Production (K MT), Revenue (US$ Million), Price (USD/MT) and Gross Margin (2019-2025)
Table 48. Europe Natural Vitamins Production (K MT), Revenue (US$ Million), Price (USD/MT) and Gross Margin (2019-2025)
Table 49. Japan Natural Vitamins Production (K MT), Revenue (US$ Million), Price (USD/MT) and Gross Margin (2019-2025)
Table 50. China Natural Vitamins Production (K MT), Revenue (US$ Million), Price (USD/MT) and Gross Margin (2019-2025)
Table 51. Ddrops Natural Vitamins Basic Information
Table 52. Ddrops Natural Vitamins Product Overview
Table 53. Ddrops Natural Vitamins Sales (K MT), Revenue (M USD), Price (USD/MT) and Gross Margin (2019-2025)
Table 54. Ddrops Business Overview
Table 55. Ddrops Natural Vitamins SWOT Analysis
Table 56. Ddrops Recent Developments
Table 57. Bayer Natural Vitamins Basic Information
Table 58. Bayer Natural Vitamins Product Overview
Table 59. Bayer Natural Vitamins Sales (K MT), Revenue (M USD), Price (USD/MT) and Gross Margin (2019-2025)
Table 60. Bayer Business Overview
Table 61. Bayer Natural Vitamins SWOT Analysis
Table 62. Bayer Recent Developments
Table 63. Koninklijke DSM Natural Vitamins Basic Information
Table 64. Koninklijke DSM Natural Vitamins Product Overview
Table 65. Koninklijke DSM Natural Vitamins Sales (K MT), Revenue (M USD), Price (USD/MT) and Gross Margin (2019-2025)
Table 66. Koninklijke DSM Natural Vitamins SWOT Analysis
Table 67. Koninklijke DSM Business Overview
Table 68. Koninklijke DSM Recent Developments
Table 69. DuPont Natural Vitamins Basic Information
Table 70. DuPont Natural Vitamins Product Overview
Table 71. DuPont Natural Vitamins Sales (K MT), Revenue (M USD), Price (USD/MT) and Gross Margin (2019-2025)
Table 72. DuPont Business Overview
Table 73. DuPont Recent Developments
Table 74. Archer Daniels Midland Natural Vitamins Basic Information
Table 75. Archer Daniels Midland Natural Vitamins Product Overview
Table 76. Archer Daniels Midland Natural Vitamins Sales (K MT), Revenue (M USD), Price (USD/MT) and Gross Margin (2019-2025)
Table 77. Archer Daniels Midland Business Overview
Table 78. Archer Daniels Midland Recent Developments
Table 79. BASF Natural Vitamins Basic Information
Table 80. BASF Natural Vitamins Product Overview
Table 81. BASF Natural Vitamins Sales (K MT), Revenue (M USD), Price (USD/MT) and Gross Margin (2019-2025)
Table 82. BASF Business Overview
Table 83. BASF Recent Developments
Table 84. Glanbia Natural Vitamins Basic Information
Table 85. Glanbia Natural Vitamins Product Overview
Table 86. Glanbia Natural Vitamins Sales (K MT), Revenue (M USD), Price (USD/MT) and Gross Margin (2019-2025)
Table 87. Glanbia Business Overview
Table 88. Glanbia Recent Developments
Table 89. NutraMarks Natural Vitamins Basic Information
Table 90. NutraMarks Natural Vitamins Product Overview
Table 91. NutraMarks Natural Vitamins Sales (K MT), Revenue (M USD), Price (USD/MT) and Gross Margin (2019-2025)
Table 92. NutraMarks Business Overview
Table 93. NutraMarks Recent Developments
Table 94. Otsuka Pharmaceutical Natural Vitamins Basic Information
Table 95. Otsuka Pharmaceutical Natural Vitamins Product Overview
Table 96. Otsuka Pharmaceutical Natural Vitamins Sales (K MT), Revenue (M USD), Price (USD/MT) and Gross Margin (2019-2025)
Table 97. Otsuka Pharmaceutical Business Overview
Table 98. Otsuka Pharmaceutical Recent Developments
Table 99. Sanofi-aventis Healthcare Natural Vitamins Basic Information
Table 100. Sanofi-aventis Healthcare Natural Vitamins Product Overview
Table 101. Sanofi-aventis Healthcare Natural Vitamins Sales (K MT), Revenue (M USD), Price (USD/MT) and Gross Margin (2019-2025)
Table 102. Sanofi-aventis Healthcare Business Overview
Table 103. Sanofi-aventis Healthcare Recent Developments
Table 104. Bioglan Natural Vitamins Basic Information
Table 105. Bioglan Natural Vitamins Product Overview
Table 106. Bioglan Natural Vitamins Sales (K MT), Revenue (M USD), Price (USD/MT) and Gross Margin (2019-2025)
Table 107. Bioglan Business Overview
Table 108. Bioglan Recent Developments
Table 109. Global Natural Vitamins Sales Forecast by Region (2025-2032) & (K MT)
Table 110. Global Natural Vitamins Market Size Forecast by Region (2025-2032) & (M USD)
Table 111. North America Natural Vitamins Sales Forecast by Country (2025-2032) & (K MT)
Table 112. North America Natural Vitamins Market Size Forecast by Country (2025-2032) & (M USD)
Table 113. Europe Natural Vitamins Sales Forecast by Country (2025-2032) & (K MT)
Table 114. Europe Natural Vitamins Market Size Forecast by Country (2025-2032) & (M USD)
Table 115. Asia Pacific Natural Vitamins Sales Forecast by Region (2025-2032) & (K MT)
Table 116. Asia Pacific Natural Vitamins Market Size Forecast by Region (2025-2032) & (M USD)
Table 117. South America Natural Vitamins Sales Forecast by Country (2025-2032) & (K MT)
Table 118. South America Natural Vitamins Market Size Forecast by Country (2025-2032) & (M USD)
Table 119. Middle East and Africa Natural Vitamins Consumption Forecast by Country (2025-2032) & (Units)
Table 120. Middle East and Africa Natural Vitamins Market Size Forecast by Country (2025-2032) & (M USD)
Table 121. Global Natural Vitamins Sales Forecast by Type (2025-2032) & (K MT)
Table 122. Global Natural Vitamins Market Size Forecast by Type (2025-2032) & (M USD)
Table 123. Global Natural Vitamins Price Forecast by Type (2025-2032) & (USD/MT)
Table 124. Global Natural Vitamins Sales (K MT) Forecast by Application (2025-2032)
Table 125. Global Natural Vitamins Market Size Forecast by Application (2025-2032) & (M USD)
List of Figures
Figure 1. Product Picture of Natural Vitamins
Figure 2. Data Triangulation
Figure 3. Key Caveats
Figure 4. Global Natural Vitamins Market Size (M USD), 2019-2032
Figure 5. Global Natural Vitamins Market Size (M USD) (2019-2032)
Figure 6. Global Natural Vitamins Sales (K MT) & (2019-2032)
Figure 7. Evaluation Matrix of Segment Market Development Potential (Type)
Figure 8. Evaluation Matrix of Segment Market Development Potential (Application)
Figure 9. Evaluation Matrix of Regional Market Development Potential
Figure 10. Natural Vitamins Market Size by Country (M USD)
Figure 11. Natural Vitamins Sales Share by Manufacturers in 2023
Figure 12. Global Natural Vitamins Revenue Share by Manufacturers in 2023
Figure 13. Natural Vitamins Market Share by Company Type (Tier 1, Tier 2 and Tier 3): 2023
Figure 14. Global Market Natural Vitamins Average Price (USD/MT) of Key Manufacturers in 2023
Figure 15. The Global 5 and 10 Largest Players: Market Share by Natural Vitamins Revenue in 2023
Figure 16. Evaluation Matrix of Segment Market Development Potential (Type)
Figure 17. Global Natural Vitamins Market Share by Type
Figure 18. Sales Market Share of Natural Vitamins by Type (2019-2025)
Figure 19. Sales Market Share of Natural Vitamins by Type in 2023
Figure 20. Market Size Share of Natural Vitamins by Type (2019-2025)
Figure 21. Market Size Market Share of Natural Vitamins by Type in 2023
Figure 22. Evaluation Matrix of Segment Market Development Potential (Application)
Figure 23. Global Natural Vitamins Market Share by Application
Figure 24. Global Natural Vitamins Sales Market Share by Application (2019-2025)
Figure 25. Global Natural Vitamins Sales Market Share by Application in 2023
Figure 26. Global Natural Vitamins Market Share by Application (2019-2025)
Figure 27. Global Natural Vitamins Market Share by Application in 2023
Figure 28. Global Natural Vitamins Sales Growth Rate by Application (2019-2025)
Figure 29. Global Natural Vitamins Sales Market Share by Region (2019-2025)
Figure 30. North America Natural Vitamins Sales and Growth Rate (2019-2025) & (K MT)
Figure 31. North America Natural Vitamins Sales Market Share by Country in 2023
Figure 32. U.S. Natural Vitamins Sales and Growth Rate (2019-2025) & (K MT)
Figure 33. Canada Natural Vitamins Sales (K MT) and Growth Rate (2019-2025)
Figure 34. Mexico Natural Vitamins Sales (Units) and Growth Rate (2019-2025)
Figure 35. Europe Natural Vitamins Sales and Growth Rate (2019-2025) & (K MT)
Figure 36. Europe Natural Vitamins Sales Market Share by Country in 2023
Figure 37. Germany Natural Vitamins Sales and Growth Rate (2019-2025) & (K MT)
Figure 38. France Natural Vitamins Sales and Growth Rate (2019-2025) & (K MT)
Figure 39. U.K. Natural Vitamins Sales and Growth Rate (2019-2025) & (K MT)
Figure 40. Italy Natural Vitamins Sales and Growth Rate (2019-2025) & (K MT)
Figure 41. Russia Natural Vitamins Sales and Growth Rate (2019-2025) & (K MT)
Figure 42. Asia Pacific Natural Vitamins Sales and Growth Rate (K MT)
Figure 43. Asia Pacific Natural Vitamins Sales Market Share by Region in 2023
Figure 44. China Natural Vitamins Sales and Growth Rate (2019-2025) & (K MT)
Figure 45. Japan Natural Vitamins Sales and Growth Rate (2019-2025) & (K MT)
Figure 46. South Korea Natural Vitamins Sales and Growth Rate (2019-2025) & (K MT)
Figure 47. India Natural Vitamins Sales and Growth Rate (2019-2025) & (K MT)
Figure 48. Southeast Asia Natural Vitamins Sales and Growth Rate (2019-2025) & (K MT)
Figure 49. South America Natural Vitamins Sales and Growth Rate (K MT)
Figure 50. South America Natural Vitamins Sales Market Share by Country in 2023
Figure 51. Brazil Natural Vitamins Sales and Growth Rate (2019-2025) & (K MT)
Figure 52. Argentina Natural Vitamins Sales and Growth Rate (2019-2025) & (K MT)
Figure 53. Columbia Natural Vitamins Sales and Growth Rate (2019-2025) & (K MT)
Figure 54. Middle East and Africa Natural Vitamins Sales and Growth Rate (K MT)
Figure 55. Middle East and Africa Natural Vitamins Sales Market Share by Region in 2023
Figure 56. Saudi Arabia Natural Vitamins Sales and Growth Rate (2019-2025) & (K MT)
Figure 57. UAE Natural Vitamins Sales and Growth Rate (2019-2025) & (K MT)
Figure 58. Egypt Natural Vitamins Sales and Growth Rate (2019-2025) & (K MT)
Figure 59. Nigeria Natural Vitamins Sales and Growth Rate (2019-2025) & (K MT)
Figure 60. South Africa Natural Vitamins Sales and Growth Rate (2019-2025) & (K MT)
Figure 61. Global Natural Vitamins Production Market Share by Region (2019-2025)
Figure 62. North America Natural Vitamins Production (K MT) Growth Rate (2019-2025)
Figure 63. Europe Natural Vitamins Production (K MT) Growth Rate (2019-2025)
Figure 64. Japan Natural Vitamins Production (K MT) Growth Rate (2019-2025)
Figure 65. China Natural Vitamins Production (K MT) Growth Rate (2019-2025)
Figure 66. Global Natural Vitamins Sales Forecast by Volume (2019-2032) & (K MT)
Figure 67. Global Natural Vitamins Market Size Forecast by Value (2019-2032) & (M USD)
Figure 68. Global Natural Vitamins Sales Market Share Forecast by Type (2025-2032)
Figure 69. Global Natural Vitamins Market Share Forecast by Type (2025-2032)
Figure 70. Global Natural Vitamins Sales Forecast by Application (2025-2032)
Figure 71. Global Natural Vitamins Market Share Forecast by Application (2025-2032)

