Near-Eye Displays (NED), also known as head-mounted displays (HMD) or wearable displays, are technology systems that project a virtual image into the viewer's field of vision. These displays utilize a combination of small panels and optics to create a visual experience that appears at a distance, resembling how objects appear in the real world, even though the actual display panel is typically much smaller. NEDs are used in various applications including Augmented Reality (AR), Virtual Reality (VR), medical imaging, and entertainment, providing a more immersive and interactive experience for the user. This market encompasses both AR and VR devices, with further segmentation based on their use in different industries and applications.
Market Size
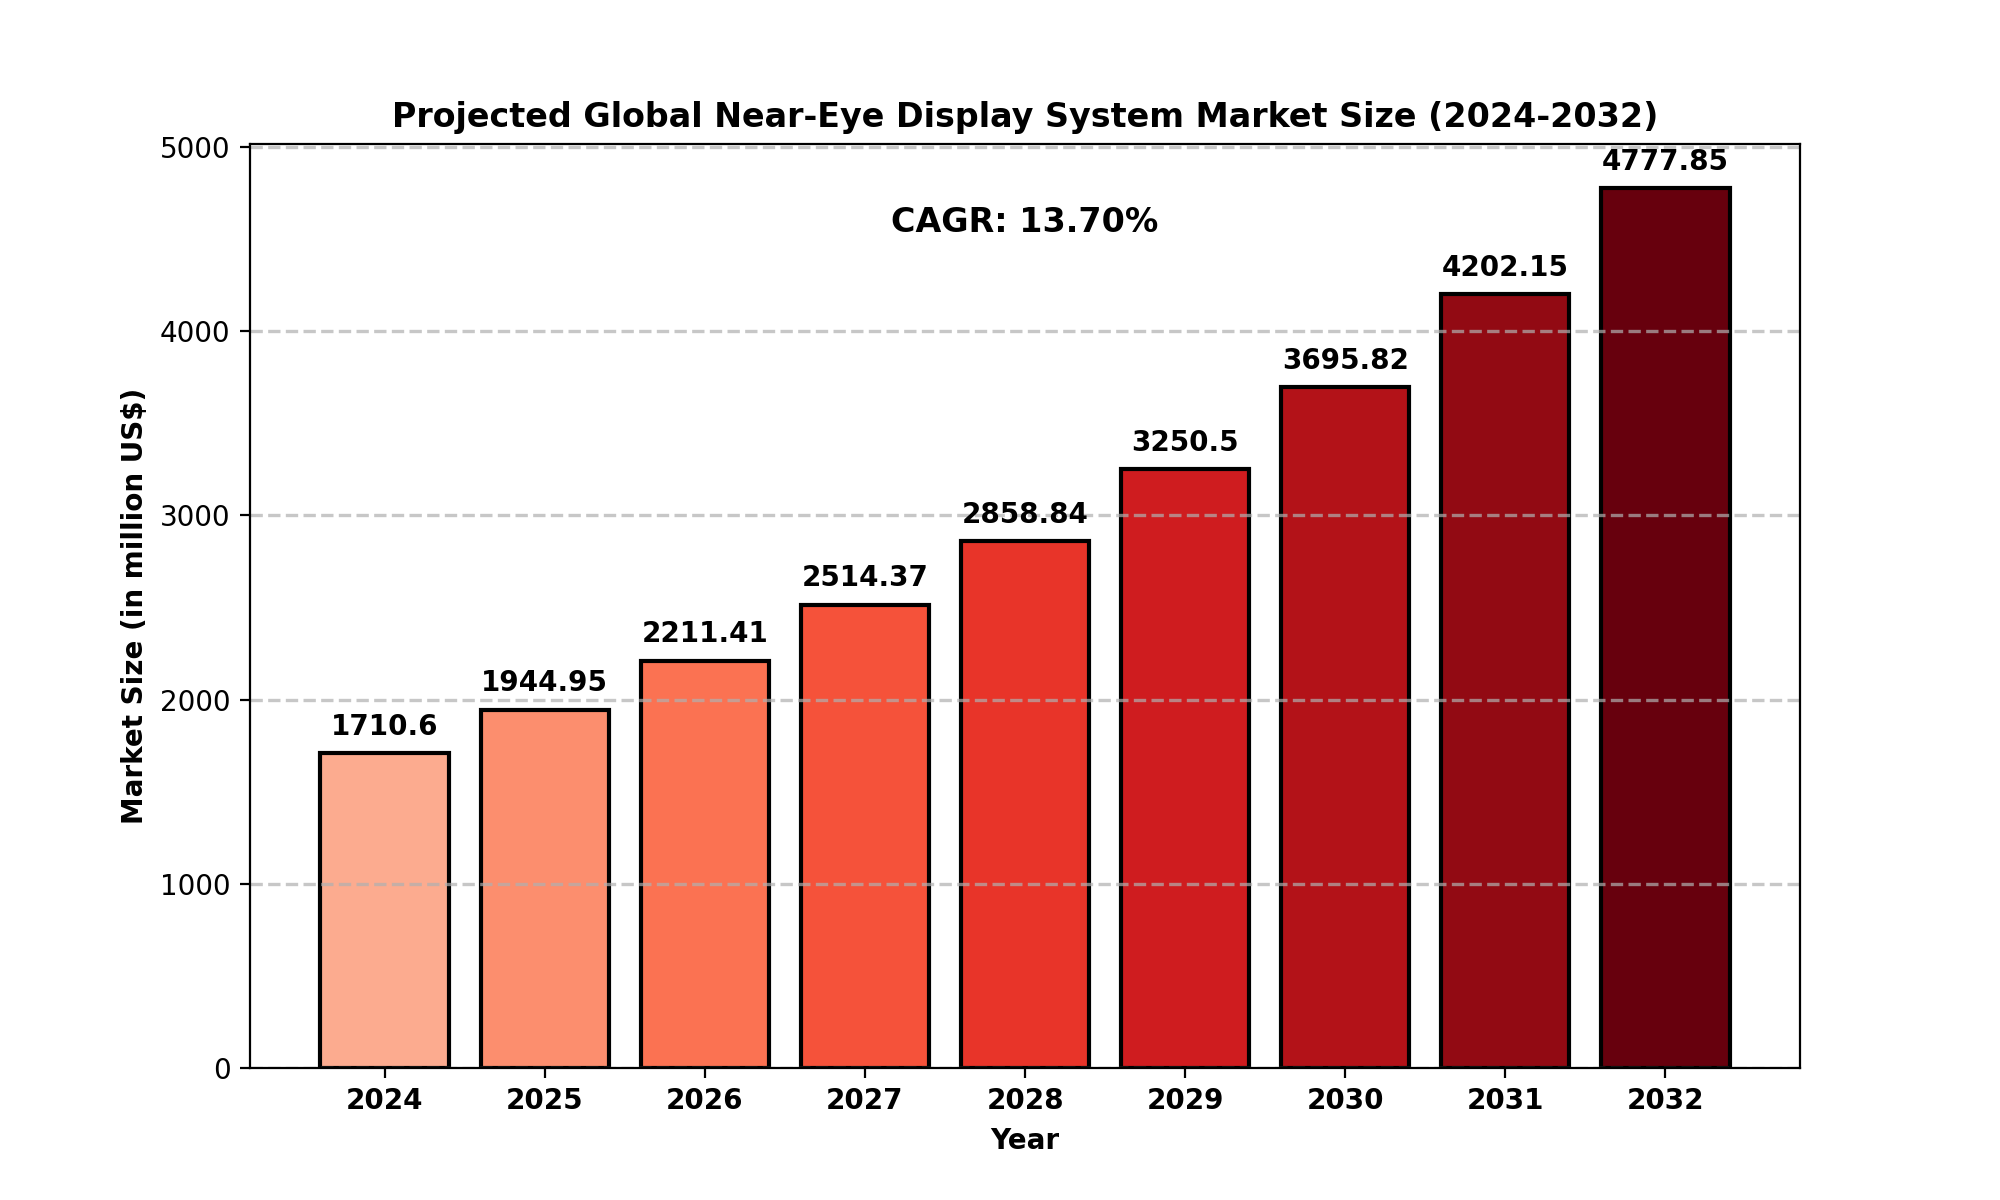
The global Near-Eye Display System market is currently valued at approximately USD 1710.60 million in 2024, and it is projected to reach USD 4777.85 million by 2032. This translates into a Compound Annual Growth Rate (CAGR) of 13.70% during the forecast period,
indicating substantial growth within the next decade. The steady rise in consumer demand for AR and VR devices, along with innovations in wearable tech, are fueling this rapid market expansion. As the technology matures and more applications emerge, the market is expected to continue to grow at a robust pace, particularly in regions like North America and Asia-Pacific.
Key Statistics:
-
Market size in 2024: USD 1710.60 million
-
Projected market size by 2032: USD 5432.41 million
-
CAGR: 13.70% from 2024 to 2032
Market Dynamics (Drivers, Restraints, Opportunities, and Challenges)
Drivers
Several key factors are driving the growth of the Near-Eye Display System market:
-
Growing demand for AR/VR applications: The increasing adoption of AR and VR technologies in various industries, including entertainment, automotive, and healthcare, is propelling the demand for NEDs.
-
Advancements in display technologies: Significant progress in OLED, micro-LED, and other advanced display technologies has improved the quality, size, and power consumption of NEDs, making them more accessible and attractive to consumers.
-
Enhanced user experiences: The need for more immersive and interactive user experiences in gaming, entertainment, education, and professional sectors has created a strong market for these wearable technologies.
-
Investment in the automotive and aerospace sectors: AR-based NED systems are being used to improve navigation and provide real-time data overlays in automotive and aerospace applications, driving market growth in these industries.
Restraints
Despite its growth, the market faces several challenges:
-
High production costs: The high cost of manufacturing these sophisticated display systems, especially with cutting-edge technologies like micro-LED, limits accessibility for mass adoption.
-
Comfort and wearability issues: Some users still face discomfort when using head-mounted displays for extended periods, especially in VR applications, which can hinder their widespread adoption.
-
Limited content and applications: Although the market for AR/VR applications is growing, there is still a limited amount of content, which affects the overall utility and value of NEDs.
Opportunities
The following opportunities are available for market players:
-
Emerging markets in healthcare and education: There is growing interest in using NEDs for medical imaging, patient care, and educational tools, creating a new set of opportunities in these sectors.
-
Next-generation AR glasses: The development of lighter, more efficient AR glasses that are more comfortable to wear for extended periods presents significant opportunities for expansion.
-
Growth in autonomous vehicles: With the rise of autonomous vehicles, there is increasing interest in integrating AR systems with NEDs for real-time navigation and system feedback.
Challenges
Key challenges include:
-
Technological limitations: Despite advances, NED systems still face challenges in terms of display clarity, battery life, and processing power, particularly for high-definition VR applications.
-
Regulatory issues: The lack of a clear regulatory framework for AR/VR technologies can slow down adoption, especially in sectors like healthcare and automotive.
Regional Analysis
North America
North America is one of the leading regions in the Near-Eye Display System market, with a market size estimated at USD 556.56 million in 2024. The demand for NEDs in this region is driven by advancements in technology, a thriving gaming and entertainment industry, and an increasing number of applications in sectors like healthcare, automotive, and defense. The region is expected to continue its dominance, growing at a CAGR of 11.74% from 2025 to 2032.
Europe
Europe is also witnessing significant growth, especially in industries like aerospace, automotive, and healthcare. Key markets in this region include the UK, Germany, and France. The adoption of AR/VR technology for training, education, and healthcare is pushing demand for NED systems.
Asia-Pacific
The Asia-Pacific region is expected to experience the highest growth rate, driven by rapid advancements in display technologies and high demand from sectors like consumer electronics and automotive. China, Japan, and South Korea are key players in the market, with major investments being made in both hardware and software development.
South America and MEA
While South America and the Middle East and Africa regions are smaller markets, they present opportunities for growth due to the rising adoption of AR/VR technologies in entertainment and educational sectors.
Competitor Analysis
Key Players
-
Sony – A leading player in the AR/VR space, known for its PlayStation VR and other advanced headsets.
-
Himax Technologies – Focuses on innovative display technologies and system integration.
-
Kopin Corporation – Specializes in microdisplays and optics, catering to AR/VR markets.
-
Samsung Electronics – A major player with a strong focus on mobile and wearable display technologies.
-
MicroOLED Technologies – Known for high-performance OLED displays tailored for NEDs.
-
BOE Technology – A global leader in the development of next-gen display panels for consumer electronics and industrial applications.
These companies dominate the competitive landscape, continuously innovating and expanding their product offerings.
Global Near-Eye Display System: Market Segmentation Analysis
This report provides a deep insight into the global Near-Eye Display System market, covering all its essential aspects. This ranges from a macro overview of the market to micro details of the market size, competitive landscape, development trend, niche market, key market drivers and challenges, SWOT analysis, value chain analysis, etc.
The analysis helps the reader to shape the competition within the industries and strategies for the competitive environment to enhance the potential profit. Furthermore, it provides a simple framework for evaluating and assessing the position of the business organization. The report structure also focuses on the competitive landscape of the Global Near-Eye Display System Market. This report introduces in detail the market share, market performance, product situation, operation situation, etc., of the main players, which helps the readers in the industry to identify the main competitors and deeply understand the competition pattern of the market.
In a word, this report is a must-read for industry players, investors, researchers, consultants, business strategists, and all those who have any kind of stake or are planning to foray into the Near-Eye Display System market in any manner.
Market Segmentation (by Application)
-
Entertainment
-
Automotive
-
Aerospace & Defense
-
Medical
-
Others
Market Segmentation (by Type)
-
AR Devices
-
VR Devices
-
Others
Key Company
-
Sony
-
Himax Technologies
-
Kopin Corporation
-
Emagin Corporation
-
MICROOLED Technologies
-
BOE Technology
-
Syndiant
-
Plessey
-
Samsung Electronics
-
JBD Xianyao Display Technology
-
TriLite Technologies
-
Texas Instruments
-
EXALOS
-
Tianma Microelectronics
-
HOLOEYE Photonics AG
-
Compound Photonics
-
Olightek
-
Ultimems
-
MicroVision
-
Mirrorcle Technologies
-
Maradin
-
OQmented
-
Microtech Technology
-
Shenzhen Anpo Intelligence Technology
-
SeeYA Technology
-
Optecks LLC
-
Shanghai Top Display Optoelectronics
-
Shenzhen Toppop Electronic
Geographic Segmentation
-
North America (USA, Canada, Mexico)
-
Europe (Germany, UK, France, Russia, Italy, Rest of Europe)
-
Asia-Pacific (China, Japan, South Korea, India, Southeast Asia, Rest of Asia-Pacific)
-
South America (Brazil, Argentina, Columbia, Rest of South America)
-
The Middle East and Africa (Saudi Arabia, UAE, Egypt, Nigeria, South Africa, Rest of MEA)
FAQ Section
What is the current market size of the Near-Eye Display System market?
Which are the key companies operating in the Near-Eye Display System market?
-
Key companies include Sony, Himax Technologies, Kopin Corporation, MICROOLED Technologies, BOE Technology, and Samsung Electronics, among others.
What are the key growth drivers in the Near-Eye Display System market?
Which regions dominate the Near-Eye Display System market?
What are the emerging trends in the Near-Eye Display System market?
Key Benefits of This Market Research:
-
Industry drivers, restraints, and opportunities covered in the study
-
Neutral perspective on the market performance
-
Recent industry trends and developments
-
Competitive landscape & strategies of key players
-
Potential & niche segments and regions exhibiting promising growth covered
-
Historical, current, and projected market size, in terms of value
-
In-depth analysis of the Near-Eye Display System Market
-
Overview of the regional outlook of the Near-Eye Display System Market:
Key Reasons to Buy this Report:
-
Access to date statistics compiled by our researchers. These provide you with historical and forecast data, which is analyzed to tell you why your market is set to change
-
This enables you to anticipate market changes to remain ahead of your competitors
-
You will be able to copy data from the Excel spreadsheet straight into your marketing plans, business presentations, or other strategic documents
-
The concise analysis, clear graph, and table format will enable you to pinpoint the information you require quickly
-
Provision of market value data for each segment and sub-segment
-
Indicates the region and segment that is expected to witness the fastest growth as well as to dominate the market
-
Analysis by geography highlighting the consumption of the product/service in the region as well as indicating the factors that are affecting the market within each region
-
Competitive landscape which incorporates the market ranking of the major players, along with new service/product launches, partnerships, business expansions, and acquisitions in the past five years of companies profiled
-
Extensive company profiles comprising of company overview, company insights, product benchmarking, and SWOT analysis for the major market players
-
The current as well as the future market outlook of the industry concerning recent developments which involve growth opportunities and drivers as well as challenges and restraints of both emerging as well as developed regions
-
Includes in-depth analysis of the market from various perspectives through Porter
TABLE OF CONTENTS
Table of Contents
1 Research Methodology and Statistical Scope
1.1 Market Definition and Statistical Scope of Near-Eye Display System
1.2 Key Market Segments
1.2.1 Near-Eye Display System Segment by Type
1.2.2 Near-Eye Display System Segment by Application
1.3 Methodology & Sources of Information
1.3.1 Research Methodology
1.3.2 Research Process
1.3.3 Market Breakdown and Data Triangulation
1.3.4 Base Year
1.3.5 Report Assumptions & Caveats
2 Near-Eye Display System Market Overview
2.1 Global Market Overview
2.1.1 Global Near-Eye Display System Market Size (M USD) Estimates and Forecasts (2019-2032)
2.1.2 Global Near-Eye Display System Sales Estimates and Forecasts (2019-2032)
2.2 Market Segment Executive Summary
2.3 Global Market Size by Region
3 Near-Eye Display System Market Competitive Landscape
3.1 Global Near-Eye Display System Sales by Manufacturers (2019-2025)
3.2 Global Near-Eye Display System Revenue Market Share by Manufacturers (2019-2025)
3.3 Near-Eye Display System Market Share by Company Type (Tier 1, Tier 2, and Tier 3)
3.4 Global Near-Eye Display System Average Price by Manufacturers (2019-2025)
3.5 Manufacturers Near-Eye Display System Sales Sites, Area Served, Product Type
3.6 Near-Eye Display System Market Competitive Situation and Trends
3.6.1 Near-Eye Display System Market Concentration Rate
3.6.2 Global 5 and 10 Largest Near-Eye Display System Players Market Share by Revenue
3.6.3 Mergers & Acquisitions, Expansion
4 Near-Eye Display System Industry Chain Analysis
4.1 Near-Eye Display System Industry Chain Analysis
4.2 Market Overview of Key Raw Materials
4.3 Midstream Market Analysis
4.4 Downstream Customer Analysis
5 The Development and Dynamics of Near-Eye Display System Market
5.1 Key Development Trends
5.2 Driving Factors
5.3 Market Challenges
5.4 Market Restraints
5.5 Industry News
5.5.1 New Product Developments
5.5.2 Mergers & Acquisitions
5.5.3 Expansions
5.5.4 Collaboration/Supply Contracts
5.6 Industry Policies
6 Near-Eye Display System Market Segmentation by Type
6.1 Evaluation Matrix of Segment Market Development Potential (Type)
6.2 Global Near-Eye Display System Sales Market Share by Type (2019-2025)
6.3 Global Near-Eye Display System Market Size Market Share by Type (2019-2025)
6.4 Global Near-Eye Display System Price by Type (2019-2025)
7 Near-Eye Display System Market Segmentation by Application
7.1 Evaluation Matrix of Segment Market Development Potential (Application)
7.2 Global Near-Eye Display System Market Sales by Application (2019-2025)
7.3 Global Near-Eye Display System Market Size (M USD) by Application (2019-2025)
7.4 Global Near-Eye Display System Sales Growth Rate by Application (2019-2025)
8 Near-Eye Display System Market Consumption by Region
8.1 Global Near-Eye Display System Sales by Region
8.1.1 Global Near-Eye Display System Sales by Region
8.1.2 Global Near-Eye Display System Sales Market Share by Region
8.2 North America
8.2.1 North America Near-Eye Display System Sales by Country
8.2.2 U.S.
8.2.3 Canada
8.2.4 Mexico
8.3 Europe
8.3.1 Europe Near-Eye Display System Sales by Country
8.3.2 Germany
8.3.3 France
8.3.4 U.K.
8.3.5 Italy
8.3.6 Russia
8.4 Asia Pacific
8.4.1 Asia Pacific Near-Eye Display System Sales by Region
8.4.2 China
8.4.3 Japan
8.4.4 South Korea
8.4.5 India
8.4.6 Southeast Asia
8.5 South America
8.5.1 South America Near-Eye Display System Sales by Country
8.5.2 Brazil
8.5.3 Argentina
8.5.4 Columbia
8.6 Middle East and Africa
8.6.1 Middle East and Africa Near-Eye Display System Sales by Region
8.6.2 Saudi Arabia
8.6.3 UAE
8.6.4 Egypt
8.6.5 Nigeria
8.6.6 South Africa
9 Near-Eye Display System Market Production by Region
9.1 Global Production of Near-Eye Display System by Region (2019-2025)
9.2 Global Near-Eye Display System Revenue Market Share by Region (2019-2025)
9.3 Global Near-Eye Display System Production, Revenue, Price and Gross Margin (2019-2025)
9.4 North America Near-Eye Display System Production
9.4.1 North America Near-Eye Display System Production Growth Rate (2019-2025)
9.4.2 North America Near-Eye Display System Production, Revenue, Price and Gross Margin (2019-2025)
9.5 Europe Near-Eye Display System Production
9.5.1 Europe Near-Eye Display System Production Growth Rate (2019-2025)
9.5.2 Europe Near-Eye Display System Production, Revenue, Price and Gross Margin (2019-2025)
9.6 Japan Near-Eye Display System Production (2019-2025)
9.6.1 Japan Near-Eye Display System Production Growth Rate (2019-2025)
9.6.2 Japan Near-Eye Display System Production, Revenue, Price and Gross Margin (2019-2025)
9.7 China Near-Eye Display System Production (2019-2025)
9.7.1 China Near-Eye Display System Production Growth Rate (2019-2025)
9.7.2 China Near-Eye Display System Production, Revenue, Price and Gross Margin (2019-2025)
10 Key Companies Profile
10.1 Sony
10.1.1 Sony Near-Eye Display System Basic Information
10.1.2 Sony Near-Eye Display System Product Overview
10.1.3 Sony Near-Eye Display System Product Market Performance
10.1.4 Sony Business Overview
10.1.5 Sony Near-Eye Display System SWOT Analysis
10.1.6 Sony Recent Developments
10.2 Himax Technologies
10.2.1 Himax Technologies Near-Eye Display System Basic Information
10.2.2 Himax Technologies Near-Eye Display System Product Overview
10.2.3 Himax Technologies Near-Eye Display System Product Market Performance
10.2.4 Himax Technologies Business Overview
10.2.5 Himax Technologies Near-Eye Display System SWOT Analysis
10.2.6 Himax Technologies Recent Developments
10.3 Kopin Corporation
10.3.1 Kopin Corporation Near-Eye Display System Basic Information
10.3.2 Kopin Corporation Near-Eye Display System Product Overview
10.3.3 Kopin Corporation Near-Eye Display System Product Market Performance
10.3.4 Kopin Corporation Near-Eye Display System SWOT Analysis
10.3.5 Kopin Corporation Business Overview
10.3.6 Kopin Corporation Recent Developments
10.4 Emagin Corporation
10.4.1 Emagin Corporation Near-Eye Display System Basic Information
10.4.2 Emagin Corporation Near-Eye Display System Product Overview
10.4.3 Emagin Corporation Near-Eye Display System Product Market Performance
10.4.4 Emagin Corporation Business Overview
10.4.5 Emagin Corporation Recent Developments
10.5 MICROOLED Technologies
10.5.1 MICROOLED Technologies Near-Eye Display System Basic Information
10.5.2 MICROOLED Technologies Near-Eye Display System Product Overview
10.5.3 MICROOLED Technologies Near-Eye Display System Product Market Performance
10.5.4 MICROOLED Technologies Business Overview
10.5.5 MICROOLED Technologies Recent Developments
10.6 BOE Technology
10.6.1 BOE Technology Near-Eye Display System Basic Information
10.6.2 BOE Technology Near-Eye Display System Product Overview
10.6.3 BOE Technology Near-Eye Display System Product Market Performance
10.6.4 BOE Technology Business Overview
10.6.5 BOE Technology Recent Developments
10.7 Syndiant
10.7.1 Syndiant Near-Eye Display System Basic Information
10.7.2 Syndiant Near-Eye Display System Product Overview
10.7.3 Syndiant Near-Eye Display System Product Market Performance
10.7.4 Syndiant Business Overview
10.7.5 Syndiant Recent Developments
10.8 Plessey
10.8.1 Plessey Near-Eye Display System Basic Information
10.8.2 Plessey Near-Eye Display System Product Overview
10.8.3 Plessey Near-Eye Display System Product Market Performance
10.8.4 Plessey Business Overview
10.8.5 Plessey Recent Developments
10.9 Samsung Electronics
10.9.1 Samsung Electronics Near-Eye Display System Basic Information
10.9.2 Samsung Electronics Near-Eye Display System Product Overview
10.9.3 Samsung Electronics Near-Eye Display System Product Market Performance
10.9.4 Samsung Electronics Business Overview
10.9.5 Samsung Electronics Recent Developments
10.10 JBD Xianyao Display Technology
10.10.1 JBD Xianyao Display Technology Near-Eye Display System Basic Information
10.10.2 JBD Xianyao Display Technology Near-Eye Display System Product Overview
10.10.3 JBD Xianyao Display Technology Near-Eye Display System Product Market Performance
10.10.4 JBD Xianyao Display Technology Business Overview
10.10.5 JBD Xianyao Display Technology Recent Developments
10.11 TriLite Technologies
10.11.1 TriLite Technologies Near-Eye Display System Basic Information
10.11.2 TriLite Technologies Near-Eye Display System Product Overview
10.11.3 TriLite Technologies Near-Eye Display System Product Market Performance
10.11.4 TriLite Technologies Business Overview
10.11.5 TriLite Technologies Recent Developments
10.12 Texas Instruments
10.12.1 Texas Instruments Near-Eye Display System Basic Information
10.12.2 Texas Instruments Near-Eye Display System Product Overview
10.12.3 Texas Instruments Near-Eye Display System Product Market Performance
10.12.4 Texas Instruments Business Overview
10.12.5 Texas Instruments Recent Developments
10.13 EXALOS
10.13.1 EXALOS Near-Eye Display System Basic Information
10.13.2 EXALOS Near-Eye Display System Product Overview
10.13.3 EXALOS Near-Eye Display System Product Market Performance
10.13.4 EXALOS Business Overview
10.13.5 EXALOS Recent Developments
10.14 Tianma Microelectronics
10.14.1 Tianma Microelectronics Near-Eye Display System Basic Information
10.14.2 Tianma Microelectronics Near-Eye Display System Product Overview
10.14.3 Tianma Microelectronics Near-Eye Display System Product Market Performance
10.14.4 Tianma Microelectronics Business Overview
10.14.5 Tianma Microelectronics Recent Developments
10.15 HOLOEYE Photonics AG
10.15.1 HOLOEYE Photonics AG Near-Eye Display System Basic Information
10.15.2 HOLOEYE Photonics AG Near-Eye Display System Product Overview
10.15.3 HOLOEYE Photonics AG Near-Eye Display System Product Market Performance
10.15.4 HOLOEYE Photonics AG Business Overview
10.15.5 HOLOEYE Photonics AG Recent Developments
10.16 Compound Photonics
10.16.1 Compound Photonics Near-Eye Display System Basic Information
10.16.2 Compound Photonics Near-Eye Display System Product Overview
10.16.3 Compound Photonics Near-Eye Display System Product Market Performance
10.16.4 Compound Photonics Business Overview
10.16.5 Compound Photonics Recent Developments
10.17 Olightek
10.17.1 Olightek Near-Eye Display System Basic Information
10.17.2 Olightek Near-Eye Display System Product Overview
10.17.3 Olightek Near-Eye Display System Product Market Performance
10.17.4 Olightek Business Overview
10.17.5 Olightek Recent Developments
10.18 Ultimems
10.18.1 Ultimems Near-Eye Display System Basic Information
10.18.2 Ultimems Near-Eye Display System Product Overview
10.18.3 Ultimems Near-Eye Display System Product Market Performance
10.18.4 Ultimems Business Overview
10.18.5 Ultimems Recent Developments
10.19 MicroVision
10.19.1 MicroVision Near-Eye Display System Basic Information
10.19.2 MicroVision Near-Eye Display System Product Overview
10.19.3 MicroVision Near-Eye Display System Product Market Performance
10.19.4 MicroVision Business Overview
10.19.5 MicroVision Recent Developments
10.20 Mirrorcle Technologies
10.20.1 Mirrorcle Technologies Near-Eye Display System Basic Information
10.20.2 Mirrorcle Technologies Near-Eye Display System Product Overview
10.20.3 Mirrorcle Technologies Near-Eye Display System Product Market Performance
10.20.4 Mirrorcle Technologies Business Overview
10.20.5 Mirrorcle Technologies Recent Developments
10.21 Maradin
10.21.1 Maradin Near-Eye Display System Basic Information
10.21.2 Maradin Near-Eye Display System Product Overview
10.21.3 Maradin Near-Eye Display System Product Market Performance
10.21.4 Maradin Business Overview
10.21.5 Maradin Recent Developments
10.22 OQmented
10.22.1 OQmented Near-Eye Display System Basic Information
10.22.2 OQmented Near-Eye Display System Product Overview
10.22.3 OQmented Near-Eye Display System Product Market Performance
10.22.4 OQmented Business Overview
10.22.5 OQmented Recent Developments
10.23 Microtech Technology
10.23.1 Microtech Technology Near-Eye Display System Basic Information
10.23.2 Microtech Technology Near-Eye Display System Product Overview
10.23.3 Microtech Technology Near-Eye Display System Product Market Performance
10.23.4 Microtech Technology Business Overview
10.23.5 Microtech Technology Recent Developments
10.24 Shenzhen Anpo Intelligence Technology
10.24.1 Shenzhen Anpo Intelligence Technology Near-Eye Display System Basic Information
10.24.2 Shenzhen Anpo Intelligence Technology Near-Eye Display System Product Overview
10.24.3 Shenzhen Anpo Intelligence Technology Near-Eye Display System Product Market Performance
10.24.4 Shenzhen Anpo Intelligence Technology Business Overview
10.24.5 Shenzhen Anpo Intelligence Technology Recent Developments
10.25 SeeYA Technology
10.25.1 SeeYA Technology Near-Eye Display System Basic Information
10.25.2 SeeYA Technology Near-Eye Display System Product Overview
10.25.3 SeeYA Technology Near-Eye Display System Product Market Performance
10.25.4 SeeYA Technology Business Overview
10.25.5 SeeYA Technology Recent Developments
10.26 Optecks
10.26.1 Optecks Near-Eye Display System Basic Information
10.26.2 Optecks Near-Eye Display System Product Overview
10.26.3 Optecks Near-Eye Display System Product Market Performance
10.26.4 Optecks Business Overview
10.26.5 Optecks Recent Developments
10.27 LLC
10.27.1 LLC Near-Eye Display System Basic Information
10.27.2 LLC Near-Eye Display System Product Overview
10.27.3 LLC Near-Eye Display System Product Market Performance
10.27.4 LLC Business Overview
10.27.5 LLC Recent Developments
10.28 Shanghai Top Display Optoelectronics
10.28.1 Shanghai Top Display Optoelectronics Near-Eye Display System Basic Information
10.28.2 Shanghai Top Display Optoelectronics Near-Eye Display System Product Overview
10.28.3 Shanghai Top Display Optoelectronics Near-Eye Display System Product Market Performance
10.28.4 Shanghai Top Display Optoelectronics Business Overview
10.28.5 Shanghai Top Display Optoelectronics Recent Developments
10.29 Shenzhen Toppop Electronic
10.29.1 Shenzhen Toppop Electronic Near-Eye Display System Basic Information
10.29.2 Shenzhen Toppop Electronic Near-Eye Display System Product Overview
10.29.3 Shenzhen Toppop Electronic Near-Eye Display System Product Market Performance
10.29.4 Shenzhen Toppop Electronic Business Overview
10.29.5 Shenzhen Toppop Electronic Recent Developments
11 Near-Eye Display System Market Forecast by Region
11.1 Global Near-Eye Display System Market Size Forecast
11.2 Global Near-Eye Display System Market Forecast by Region
11.2.1 North America Market Size Forecast by Country
11.2.2 Europe Near-Eye Display System Market Size Forecast by Country
11.2.3 Asia Pacific Near-Eye Display System Market Size Forecast by Region
11.2.4 South America Near-Eye Display System Market Size Forecast by Country
11.2.5 Middle East and Africa Forecasted Consumption of Near-Eye Display System by Country
12 Forecast Market by Type and by Application (2025-2032)
12.1 Global Near-Eye Display System Market Forecast by Type (2025-2032)
12.1.1 Global Forecasted Sales of Near-Eye Display System by Type (2025-2032)
12.1.2 Global Near-Eye Display System Market Size Forecast by Type (2025-2032)
12.1.3 Global Forecasted Price of Near-Eye Display System by Type (2025-2032)
12.2 Global Near-Eye Display System Market Forecast by Application (2025-2032)
12.2.1 Global Near-Eye Display System Sales (K Units) Forecast by Application
12.2.2 Global Near-Eye Display System Market Size (M USD) Forecast by Application (2025-2032)
13 Conclusion and Key Findings
LIST OF TABLES & FIGURES
List of Tables
Table 1. Introduction of the Type
Table 2. Introduction of the Application
Table 3. Market Size (M USD) Segment Executive Summary
Table 4. Near-Eye Display System Market Size Comparison by Region (M USD)
Table 5. Global Near-Eye Display System Sales (K Units) by Manufacturers (2019-2025)
Table 6. Global Near-Eye Display System Sales Market Share by Manufacturers (2019-2025)
Table 7. Global Near-Eye Display System Revenue (M USD) by Manufacturers (2019-2025)
Table 8. Global Near-Eye Display System Revenue Share by Manufacturers (2019-2025)
Table 9. Company Type (Tier 1, Tier 2, and Tier 3) & (based on the Revenue in Near-Eye Display System as of 2022)
Table 10. Global Market Near-Eye Display System Average Price (USD/Unit) of Key Manufacturers (2019-2025)
Table 11. Manufacturers Near-Eye Display System Sales Sites and Area Served
Table 12. Manufacturers Near-Eye Display System Product Type
Table 13. Global Near-Eye Display System Manufacturers Market Concentration Ratio (CR5 and HHI)
Table 14. Mergers & Acquisitions, Expansion Plans
Table 15. Industry Chain Map of Near-Eye Display System
Table 16. Market Overview of Key Raw Materials
Table 17. Midstream Market Analysis
Table 18. Downstream Customer Analysis
Table 19. Key Development Trends
Table 20. Driving Factors
Table 21. Near-Eye Display System Market Challenges
Table 22. Global Near-Eye Display System Sales by Type (K Units)
Table 23. Global Near-Eye Display System Market Size by Type (M USD)
Table 24. Global Near-Eye Display System Sales (K Units) by Type (2019-2025)
Table 25. Global Near-Eye Display System Sales Market Share by Type (2019-2025)
Table 26. Global Near-Eye Display System Market Size (M USD) by Type (2019-2025)
Table 27. Global Near-Eye Display System Market Size Share by Type (2019-2025)
Table 28. Global Near-Eye Display System Price (USD/Unit) by Type (2019-2025)
Table 29. Global Near-Eye Display System Sales (K Units) by Application
Table 30. Global Near-Eye Display System Market Size by Application
Table 31. Global Near-Eye Display System Sales by Application (2019-2025) & (K Units)
Table 32. Global Near-Eye Display System Sales Market Share by Application (2019-2025)
Table 33. Global Near-Eye Display System Sales by Application (2019-2025) & (M USD)
Table 34. Global Near-Eye Display System Market Share by Application (2019-2025)
Table 35. Global Near-Eye Display System Sales Growth Rate by Application (2019-2025)
Table 36. Global Near-Eye Display System Sales by Region (2019-2025) & (K Units)
Table 37. Global Near-Eye Display System Sales Market Share by Region (2019-2025)
Table 38. North America Near-Eye Display System Sales by Country (2019-2025) & (K Units)
Table 39. Europe Near-Eye Display System Sales by Country (2019-2025) & (K Units)
Table 40. Asia Pacific Near-Eye Display System Sales by Region (2019-2025) & (K Units)
Table 41. South America Near-Eye Display System Sales by Country (2019-2025) & (K Units)
Table 42. Middle East and Africa Near-Eye Display System Sales by Region (2019-2025) & (K Units)
Table 43. Global Near-Eye Display System Production (K Units) by Region (2019-2025)
Table 44. Global Near-Eye Display System Revenue (US$ Million) by Region (2019-2025)
Table 45. Global Near-Eye Display System Revenue Market Share by Region (2019-2025)
Table 46. Global Near-Eye Display System Production (K Units), Revenue (US$ Million), Price (USD/Unit) and Gross Margin (2019-2025)
Table 47. North America Near-Eye Display System Production (K Units), Revenue (US$ Million), Price (USD/Unit) and Gross Margin (2019-2025)
Table 48. Europe Near-Eye Display System Production (K Units), Revenue (US$ Million), Price (USD/Unit) and Gross Margin (2019-2025)
Table 49. Japan Near-Eye Display System Production (K Units), Revenue (US$ Million), Price (USD/Unit) and Gross Margin (2019-2025)
Table 50. China Near-Eye Display System Production (K Units), Revenue (US$ Million), Price (USD/Unit) and Gross Margin (2019-2025)
Table 51. Sony Near-Eye Display System Basic Information
Table 52. Sony Near-Eye Display System Product Overview
Table 53. Sony Near-Eye Display System Sales (K Units), Revenue (M USD), Price (USD/Unit) and Gross Margin (2019-2025)
Table 54. Sony Business Overview
Table 55. Sony Near-Eye Display System SWOT Analysis
Table 56. Sony Recent Developments
Table 57. Himax Technologies Near-Eye Display System Basic Information
Table 58. Himax Technologies Near-Eye Display System Product Overview
Table 59. Himax Technologies Near-Eye Display System Sales (K Units), Revenue (M USD), Price (USD/Unit) and Gross Margin (2019-2025)
Table 60. Himax Technologies Business Overview
Table 61. Himax Technologies Near-Eye Display System SWOT Analysis
Table 62. Himax Technologies Recent Developments
Table 63. Kopin Corporation Near-Eye Display System Basic Information
Table 64. Kopin Corporation Near-Eye Display System Product Overview
Table 65. Kopin Corporation Near-Eye Display System Sales (K Units), Revenue (M USD), Price (USD/Unit) and Gross Margin (2019-2025)
Table 66. Kopin Corporation Near-Eye Display System SWOT Analysis
Table 67. Kopin Corporation Business Overview
Table 68. Kopin Corporation Recent Developments
Table 69. Emagin Corporation Near-Eye Display System Basic Information
Table 70. Emagin Corporation Near-Eye Display System Product Overview
Table 71. Emagin Corporation Near-Eye Display System Sales (K Units), Revenue (M USD), Price (USD/Unit) and Gross Margin (2019-2025)
Table 72. Emagin Corporation Business Overview
Table 73. Emagin Corporation Recent Developments
Table 74. MICROOLED Technologies Near-Eye Display System Basic Information
Table 75. MICROOLED Technologies Near-Eye Display System Product Overview
Table 76. MICROOLED Technologies Near-Eye Display System Sales (K Units), Revenue (M USD), Price (USD/Unit) and Gross Margin (2019-2025)
Table 77. MICROOLED Technologies Business Overview
Table 78. MICROOLED Technologies Recent Developments
Table 79. BOE Technology Near-Eye Display System Basic Information
Table 80. BOE Technology Near-Eye Display System Product Overview
Table 81. BOE Technology Near-Eye Display System Sales (K Units), Revenue (M USD), Price (USD/Unit) and Gross Margin (2019-2025)
Table 82. BOE Technology Business Overview
Table 83. BOE Technology Recent Developments
Table 84. Syndiant Near-Eye Display System Basic Information
Table 85. Syndiant Near-Eye Display System Product Overview
Table 86. Syndiant Near-Eye Display System Sales (K Units), Revenue (M USD), Price (USD/Unit) and Gross Margin (2019-2025)
Table 87. Syndiant Business Overview
Table 88. Syndiant Recent Developments
Table 89. Plessey Near-Eye Display System Basic Information
Table 90. Plessey Near-Eye Display System Product Overview
Table 91. Plessey Near-Eye Display System Sales (K Units), Revenue (M USD), Price (USD/Unit) and Gross Margin (2019-2025)
Table 92. Plessey Business Overview
Table 93. Plessey Recent Developments
Table 94. Samsung Electronics Near-Eye Display System Basic Information
Table 95. Samsung Electronics Near-Eye Display System Product Overview
Table 96. Samsung Electronics Near-Eye Display System Sales (K Units), Revenue (M USD), Price (USD/Unit) and Gross Margin (2019-2025)
Table 97. Samsung Electronics Business Overview
Table 98. Samsung Electronics Recent Developments
Table 99. JBD Xianyao Display Technology Near-Eye Display System Basic Information
Table 100. JBD Xianyao Display Technology Near-Eye Display System Product Overview
Table 101. JBD Xianyao Display Technology Near-Eye Display System Sales (K Units), Revenue (M USD), Price (USD/Unit) and Gross Margin (2019-2025)
Table 102. JBD Xianyao Display Technology Business Overview
Table 103. JBD Xianyao Display Technology Recent Developments
Table 104. TriLite Technologies Near-Eye Display System Basic Information
Table 105. TriLite Technologies Near-Eye Display System Product Overview
Table 106. TriLite Technologies Near-Eye Display System Sales (K Units), Revenue (M USD), Price (USD/Unit) and Gross Margin (2019-2025)
Table 107. TriLite Technologies Business Overview
Table 108. TriLite Technologies Recent Developments
Table 109. Texas Instruments Near-Eye Display System Basic Information
Table 110. Texas Instruments Near-Eye Display System Product Overview
Table 111. Texas Instruments Near-Eye Display System Sales (K Units), Revenue (M USD), Price (USD/Unit) and Gross Margin (2019-2025)
Table 112. Texas Instruments Business Overview
Table 113. Texas Instruments Recent Developments
Table 114. EXALOS Near-Eye Display System Basic Information
Table 115. EXALOS Near-Eye Display System Product Overview
Table 116. EXALOS Near-Eye Display System Sales (K Units), Revenue (M USD), Price (USD/Unit) and Gross Margin (2019-2025)
Table 117. EXALOS Business Overview
Table 118. EXALOS Recent Developments
Table 119. Tianma Microelectronics Near-Eye Display System Basic Information
Table 120. Tianma Microelectronics Near-Eye Display System Product Overview
Table 121. Tianma Microelectronics Near-Eye Display System Sales (K Units), Revenue (M USD), Price (USD/Unit) and Gross Margin (2019-2025)
Table 122. Tianma Microelectronics Business Overview
Table 123. Tianma Microelectronics Recent Developments
Table 124. HOLOEYE Photonics AG Near-Eye Display System Basic Information
Table 125. HOLOEYE Photonics AG Near-Eye Display System Product Overview
Table 126. HOLOEYE Photonics AG Near-Eye Display System Sales (K Units), Revenue (M USD), Price (USD/Unit) and Gross Margin (2019-2025)
Table 127. HOLOEYE Photonics AG Business Overview
Table 128. HOLOEYE Photonics AG Recent Developments
Table 129. Compound Photonics Near-Eye Display System Basic Information
Table 130. Compound Photonics Near-Eye Display System Product Overview
Table 131. Compound Photonics Near-Eye Display System Sales (K Units), Revenue (M USD), Price (USD/Unit) and Gross Margin (2019-2025)
Table 132. Compound Photonics Business Overview
Table 133. Compound Photonics Recent Developments
Table 134. Olightek Near-Eye Display System Basic Information
Table 135. Olightek Near-Eye Display System Product Overview
Table 136. Olightek Near-Eye Display System Sales (K Units), Revenue (M USD), Price (USD/Unit) and Gross Margin (2019-2025)
Table 137. Olightek Business Overview
Table 138. Olightek Recent Developments
Table 139. Ultimems Near-Eye Display System Basic Information
Table 140. Ultimems Near-Eye Display System Product Overview
Table 141. Ultimems Near-Eye Display System Sales (K Units), Revenue (M USD), Price (USD/Unit) and Gross Margin (2019-2025)
Table 142. Ultimems Business Overview
Table 143. Ultimems Recent Developments
Table 144. MicroVision Near-Eye Display System Basic Information
Table 145. MicroVision Near-Eye Display System Product Overview
Table 146. MicroVision Near-Eye Display System Sales (K Units), Revenue (M USD), Price (USD/Unit) and Gross Margin (2019-2025)
Table 147. MicroVision Business Overview
Table 148. MicroVision Recent Developments
Table 149. Mirrorcle Technologies Near-Eye Display System Basic Information
Table 150. Mirrorcle Technologies Near-Eye Display System Product Overview
Table 151. Mirrorcle Technologies Near-Eye Display System Sales (K Units), Revenue (M USD), Price (USD/Unit) and Gross Margin (2019-2025)
Table 152. Mirrorcle Technologies Business Overview
Table 153. Mirrorcle Technologies Recent Developments
Table 154. Maradin Near-Eye Display System Basic Information
Table 155. Maradin Near-Eye Display System Product Overview
Table 156. Maradin Near-Eye Display System Sales (K Units), Revenue (M USD), Price (USD/Unit) and Gross Margin (2019-2025)
Table 157. Maradin Business Overview
Table 158. Maradin Recent Developments
Table 159. OQmented Near-Eye Display System Basic Information
Table 160. OQmented Near-Eye Display System Product Overview
Table 161. OQmented Near-Eye Display System Sales (K Units), Revenue (M USD), Price (USD/Unit) and Gross Margin (2019-2025)
Table 162. OQmented Business Overview
Table 163. OQmented Recent Developments
Table 164. Microtech Technology Near-Eye Display System Basic Information
Table 165. Microtech Technology Near-Eye Display System Product Overview
Table 166. Microtech Technology Near-Eye Display System Sales (K Units), Revenue (M USD), Price (USD/Unit) and Gross Margin (2019-2025)
Table 167. Microtech Technology Business Overview
Table 168. Microtech Technology Recent Developments
Table 169. Shenzhen Anpo Intelligence Technology Near-Eye Display System Basic Information
Table 170. Shenzhen Anpo Intelligence Technology Near-Eye Display System Product Overview
Table 171. Shenzhen Anpo Intelligence Technology Near-Eye Display System Sales (K Units), Revenue (M USD), Price (USD/Unit) and Gross Margin (2019-2025)
Table 172. Shenzhen Anpo Intelligence Technology Business Overview
Table 173. Shenzhen Anpo Intelligence Technology Recent Developments
Table 174. SeeYA Technology Near-Eye Display System Basic Information
Table 175. SeeYA Technology Near-Eye Display System Product Overview
Table 176. SeeYA Technology Near-Eye Display System Sales (K Units), Revenue (M USD), Price (USD/Unit) and Gross Margin (2019-2025)
Table 177. SeeYA Technology Business Overview
Table 178. SeeYA Technology Recent Developments
Table 179. Optecks Near-Eye Display System Basic Information
Table 180. Optecks Near-Eye Display System Product Overview
Table 181. Optecks Near-Eye Display System Sales (K Units), Revenue (M USD), Price (USD/Unit) and Gross Margin (2019-2025)
Table 182. Optecks Business Overview
Table 183. Optecks Recent Developments
Table 184. LLC Near-Eye Display System Basic Information
Table 185. LLC Near-Eye Display System Product Overview
Table 186. LLC Near-Eye Display System Sales (K Units), Revenue (M USD), Price (USD/Unit) and Gross Margin (2019-2025)
Table 187. LLC Business Overview
Table 188. LLC Recent Developments
Table 189. Shanghai Top Display Optoelectronics Near-Eye Display System Basic Information
Table 190. Shanghai Top Display Optoelectronics Near-Eye Display System Product Overview
Table 191. Shanghai Top Display Optoelectronics Near-Eye Display System Sales (K Units), Revenue (M USD), Price (USD/Unit) and Gross Margin (2019-2025)
Table 192. Shanghai Top Display Optoelectronics Business Overview
Table 193. Shanghai Top Display Optoelectronics Recent Developments
Table 194. Shenzhen Toppop Electronic Near-Eye Display System Basic Information
Table 195. Shenzhen Toppop Electronic Near-Eye Display System Product Overview
Table 196. Shenzhen Toppop Electronic Near-Eye Display System Sales (K Units), Revenue (M USD), Price (USD/Unit) and Gross Margin (2019-2025)
Table 197. Shenzhen Toppop Electronic Business Overview
Table 198. Shenzhen Toppop Electronic Recent Developments
Table 199. Global Near-Eye Display System Sales Forecast by Region (2025-2032) & (K Units)
Table 200. Global Near-Eye Display System Market Size Forecast by Region (2025-2032) & (M USD)
Table 201. North America Near-Eye Display System Sales Forecast by Country (2025-2032) & (K Units)
Table 202. North America Near-Eye Display System Market Size Forecast by Country (2025-2032) & (M USD)
Table 203. Europe Near-Eye Display System Sales Forecast by Country (2025-2032) & (K Units)
Table 204. Europe Near-Eye Display System Market Size Forecast by Country (2025-2032) & (M USD)
Table 205. Asia Pacific Near-Eye Display System Sales Forecast by Region (2025-2032) & (K Units)
Table 206. Asia Pacific Near-Eye Display System Market Size Forecast by Region (2025-2032) & (M USD)
Table 207. South America Near-Eye Display System Sales Forecast by Country (2025-2032) & (K Units)
Table 208. South America Near-Eye Display System Market Size Forecast by Country (2025-2032) & (M USD)
Table 209. Middle East and Africa Near-Eye Display System Consumption Forecast by Country (2025-2032) & (Units)
Table 210. Middle East and Africa Near-Eye Display System Market Size Forecast by Country (2025-2032) & (M USD)
Table 211. Global Near-Eye Display System Sales Forecast by Type (2025-2032) & (K Units)
Table 212. Global Near-Eye Display System Market Size Forecast by Type (2025-2032) & (M USD)
Table 213. Global Near-Eye Display System Price Forecast by Type (2025-2032) & (USD/Unit)
Table 214. Global Near-Eye Display System Sales (K Units) Forecast by Application (2025-2032)
Table 215. Global Near-Eye Display System Market Size Forecast by Application (2025-2032) & (M USD)
List of Figures
Figure 1. Product Picture of Near-Eye Display System
Figure 2. Data Triangulation
Figure 3. Key Caveats
Figure 4. Global Near-Eye Display System Market Size (M USD), 2019-2032
Figure 5. Global Near-Eye Display System Market Size (M USD) (2019-2032)
Figure 6. Global Near-Eye Display System Sales (K Units) & (2019-2032)
Figure 7. Evaluation Matrix of Segment Market Development Potential (Type)
Figure 8. Evaluation Matrix of Segment Market Development Potential (Application)
Figure 9. Evaluation Matrix of Regional Market Development Potential
Figure 10. Near-Eye Display System Market Size by Country (M USD)
Figure 11. Near-Eye Display System Sales Share by Manufacturers in 2023
Figure 12. Global Near-Eye Display System Revenue Share by Manufacturers in 2023
Figure 13. Near-Eye Display System Market Share by Company Type (Tier 1, Tier 2 and Tier 3): 2023
Figure 14. Global Market Near-Eye Display System Average Price (USD/Unit) of Key Manufacturers in 2023
Figure 15. The Global 5 and 10 Largest Players: Market Share by Near-Eye Display System Revenue in 2023
Figure 16. Evaluation Matrix of Segment Market Development Potential (Type)
Figure 17. Global Near-Eye Display System Market Share by Type
Figure 18. Sales Market Share of Near-Eye Display System by Type (2019-2025)
Figure 19. Sales Market Share of Near-Eye Display System by Type in 2023
Figure 20. Market Size Share of Near-Eye Display System by Type (2019-2025)
Figure 21. Market Size Market Share of Near-Eye Display System by Type in 2023
Figure 22. Evaluation Matrix of Segment Market Development Potential (Application)
Figure 23. Global Near-Eye Display System Market Share by Application
Figure 24. Global Near-Eye Display System Sales Market Share by Application (2019-2025)
Figure 25. Global Near-Eye Display System Sales Market Share by Application in 2023
Figure 26. Global Near-Eye Display System Market Share by Application (2019-2025)
Figure 27. Global Near-Eye Display System Market Share by Application in 2023
Figure 28. Global Near-Eye Display System Sales Growth Rate by Application (2019-2025)
Figure 29. Global Near-Eye Display System Sales Market Share by Region (2019-2025)
Figure 30. North America Near-Eye Display System Sales and Growth Rate (2019-2025) & (K Units)
Figure 31. North America Near-Eye Display System Sales Market Share by Country in 2023
Figure 32. U.S. Near-Eye Display System Sales and Growth Rate (2019-2025) & (K Units)
Figure 33. Canada Near-Eye Display System Sales (K Units) and Growth Rate (2019-2025)
Figure 34. Mexico Near-Eye Display System Sales (Units) and Growth Rate (2019-2025)
Figure 35. Europe Near-Eye Display System Sales and Growth Rate (2019-2025) & (K Units)
Figure 36. Europe Near-Eye Display System Sales Market Share by Country in 2023
Figure 37. Germany Near-Eye Display System Sales and Growth Rate (2019-2025) & (K Units)
Figure 38. France Near-Eye Display System Sales and Growth Rate (2019-2025) & (K Units)
Figure 39. U.K. Near-Eye Display System Sales and Growth Rate (2019-2025) & (K Units)
Figure 40. Italy Near-Eye Display System Sales and Growth Rate (2019-2025) & (K Units)
Figure 41. Russia Near-Eye Display System Sales and Growth Rate (2019-2025) & (K Units)
Figure 42. Asia Pacific Near-Eye Display System Sales and Growth Rate (K Units)
Figure 43. Asia Pacific Near-Eye Display System Sales Market Share by Region in 2023
Figure 44. China Near-Eye Display System Sales and Growth Rate (2019-2025) & (K Units)
Figure 45. Japan Near-Eye Display System Sales and Growth Rate (2019-2025) & (K Units)
Figure 46. South Korea Near-Eye Display System Sales and Growth Rate (2019-2025) & (K Units)
Figure 47. India Near-Eye Display System Sales and Growth Rate (2019-2025) & (K Units)
Figure 48. Southeast Asia Near-Eye Display System Sales and Growth Rate (2019-2025) & (K Units)
Figure 49. South America Near-Eye Display System Sales and Growth Rate (K Units)
Figure 50. South America Near-Eye Display System Sales Market Share by Country in 2023
Figure 51. Brazil Near-Eye Display System Sales and Growth Rate (2019-2025) & (K Units)
Figure 52. Argentina Near-Eye Display System Sales and Growth Rate (2019-2025) & (K Units)
Figure 53. Columbia Near-Eye Display System Sales and Growth Rate (2019-2025) & (K Units)
Figure 54. Middle East and Africa Near-Eye Display System Sales and Growth Rate (K Units)
Figure 55. Middle East and Africa Near-Eye Display System Sales Market Share by Region in 2023
Figure 56. Saudi Arabia Near-Eye Display System Sales and Growth Rate (2019-2025) & (K Units)
Figure 57. UAE Near-Eye Display System Sales and Growth Rate (2019-2025) & (K Units)
Figure 58. Egypt Near-Eye Display System Sales and Growth Rate (2019-2025) & (K Units)
Figure 59. Nigeria Near-Eye Display System Sales and Growth Rate (2019-2025) & (K Units)
Figure 60. South Africa Near-Eye Display System Sales and Growth Rate (2019-2025) & (K Units)
Figure 61. Global Near-Eye Display System Production Market Share by Region (2019-2025)
Figure 62. North America Near-Eye Display System Production (K Units) Growth Rate (2019-2025)
Figure 63. Europe Near-Eye Display System Production (K Units) Growth Rate (2019-2025)
Figure 64. Japan Near-Eye Display System Production (K Units) Growth Rate (2019-2025)
Figure 65. China Near-Eye Display System Production (K Units) Growth Rate (2019-2025)
Figure 66. Global Near-Eye Display System Sales Forecast by Volume (2019-2032) & (K Units)
Figure 67. Global Near-Eye Display System Market Size Forecast by Value (2019-2032) & (M USD)
Figure 68. Global Near-Eye Display System Sales Market Share Forecast by Type (2025-2032)
Figure 69. Global Near-Eye Display System Market Share Forecast by Type (2025-2032)
Figure 70. Global Near-Eye Display System Sales Forecast by Application (2025-2032)
Figure 71. Global Near-Eye Display System Market Share Forecast by Application (2025-2032)

