Non-Destructive Testing (NDT) and Inspection involves assessing the properties of a material, component, or structure without causing damage. It helps detect material imperfections and assess their properties without altering or destroying the object. NDT plays a crucial role in industries such as manufacturing, aerospace, automotive, oil and gas, infrastructure, and power generation, ensuring safety, efficiency, and regulatory compliance.
NDT techniques include ultrasonic testing, electromagnetic testing, leak testing, radiographic testing, liquid penetrant testing, and eddy current testing. These methods have diverse applications in inspecting materials for defects, corrosion, wear, and structural integrity. The global Non-Destructive Testing and Inspection market is expanding, driven by advancements in technology, safety standards, and industry demand for quality control.
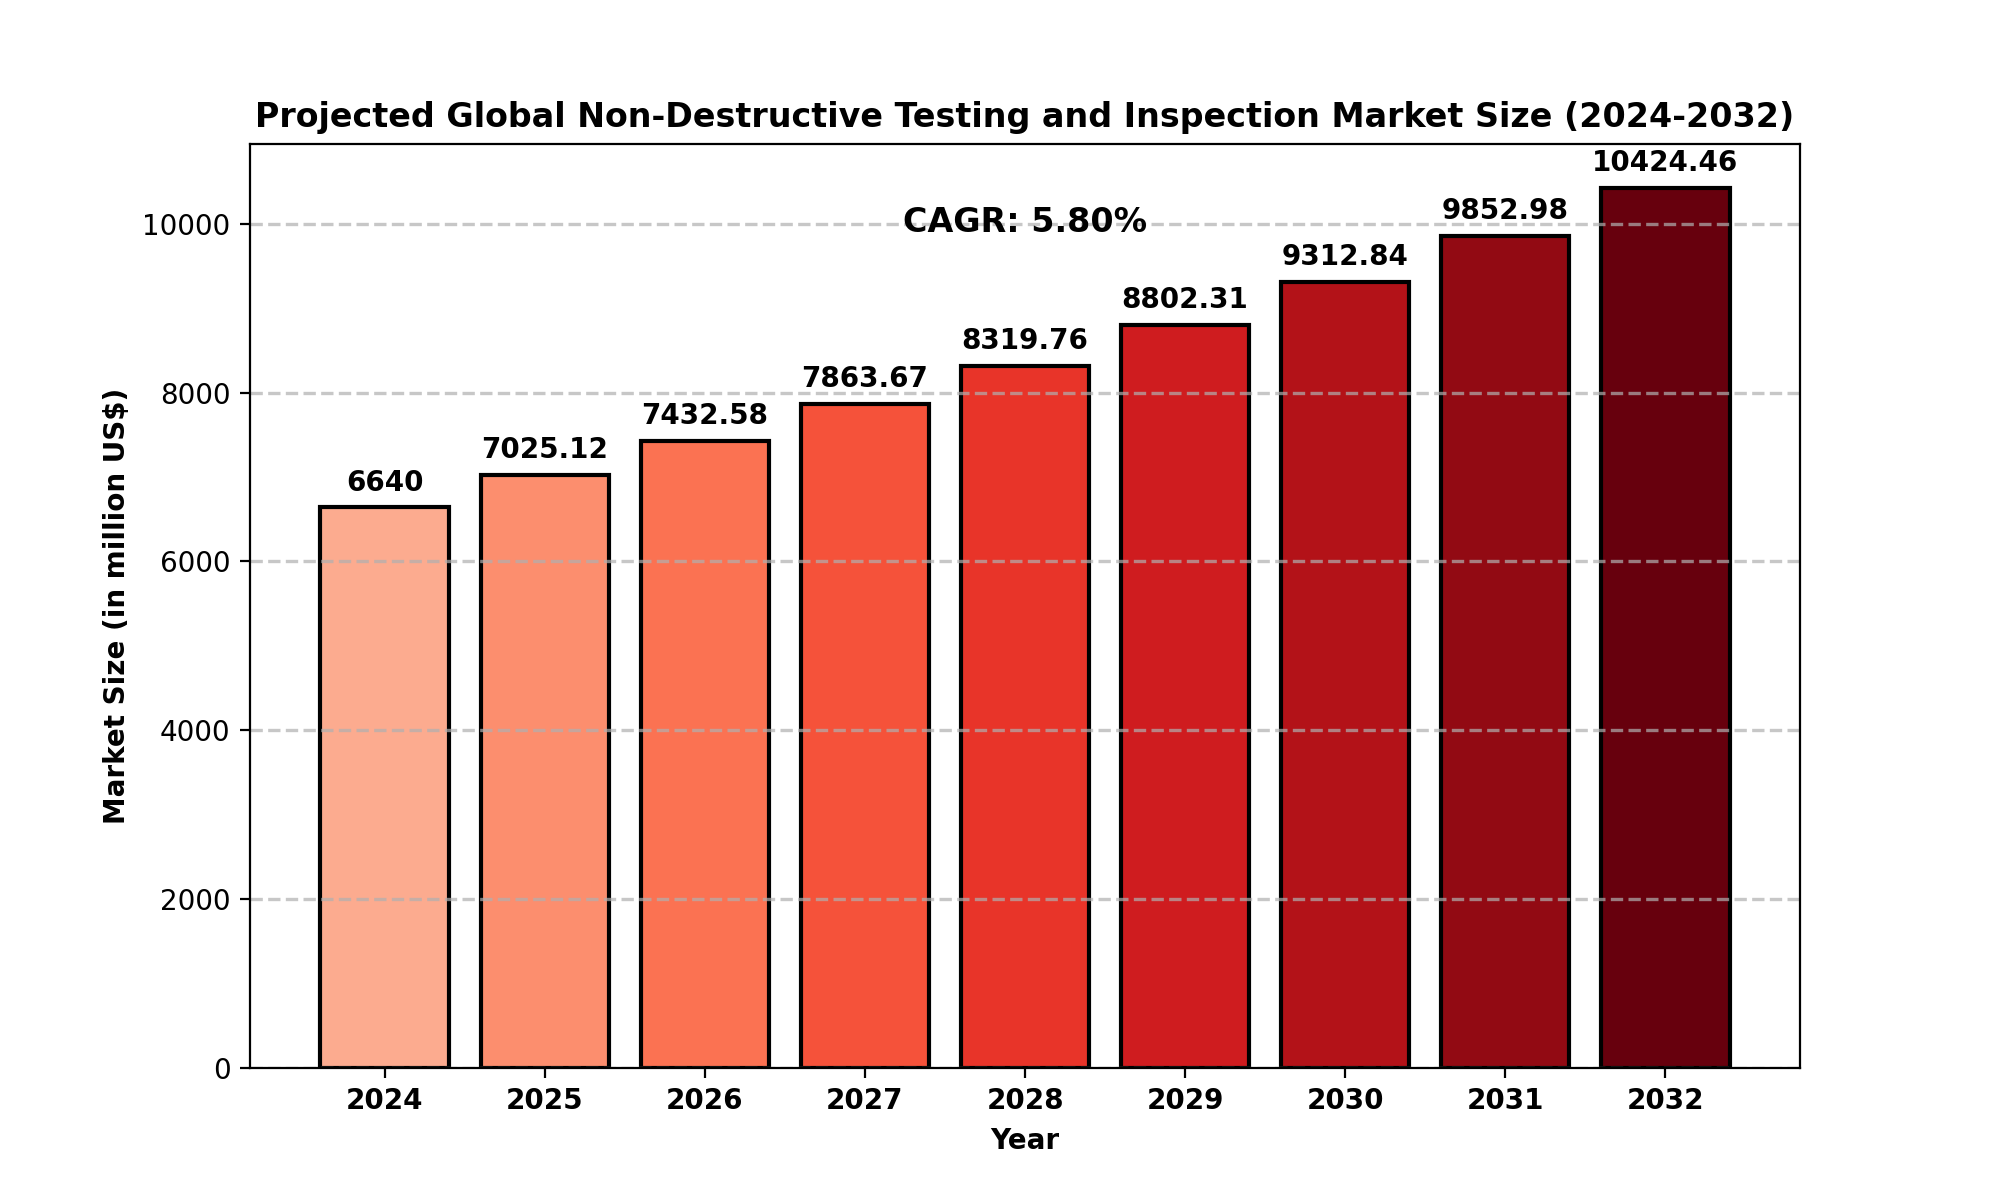
Market Size
The global Non-Destructive Testing and Inspection market size was valued at USD 6.64 billion in 2024, and it is projected to reach USD 10.42 billion by 2032, reflecting a CAGR of 5.80% over the forecast period.
This growth is driven by an increasing need for high-quality safety standards, infrastructure inspection, and maintenance in various industries.
Key statistics include:
The market’s expansion is propelled by rising safety concerns, regulatory compliance, and technological innovations in NDT methods. The market also benefits from the increasing demand for equipment rental services and training in NDT techniques, leading to new business opportunities and investments.
Market Dynamics
Drivers:
-
Advancements in Technology: The development of advanced NDT technologies, such as automated systems, drones, and AI integration, is accelerating the market's growth. These innovations offer enhanced precision, faster inspection processes, and reduced labor costs.
-
Increasing Safety Standards: Industries like aerospace, oil and gas, and power generation require stringent safety standards. NDT ensures the structural integrity of critical components, helping prevent catastrophic failures.
-
Regulatory Compliance: Governments worldwide are enforcing stricter regulations for industries involving high-risk operations. Compliance with these regulations is crucial for companies, which drives demand for NDT services.
-
Rising Demand for Equipment Rental Services: Small and medium-sized enterprises (SMEs) prefer renting NDT equipment instead of purchasing it outright, contributing to the market's growth.
Restraints:
-
High Initial Investment: NDT equipment and services require significant initial investments, which may limit market adoption, particularly in developing regions.
-
Skilled Labor Shortage: The lack of qualified personnel to perform complex NDT inspections is a challenge, as the market relies heavily on skilled technicians for accurate results.
-
Lack of Standardization: In some sectors, there is a lack of standardized NDT practices, which can lead to inconsistencies in testing results and reduced effectiveness.
Opportunities:
-
Growth in Emerging Markets: The increasing industrialization in emerging economies such as India, China, and Brazil presents a significant opportunity for NDT services, as these regions are investing in infrastructure and manufacturing.
-
Integration of AI and Automation: The use of Artificial Intelligence (AI) and machine learning in NDT inspection can significantly improve detection accuracy and reduce human error, opening new avenues for market growth.
-
Increased Demand for Maintenance: As infrastructure ages globally, there is a rising need for maintenance services, fueling demand for non-destructive testing.
Challenges:
-
Technological Limitations: Despite advancements, some NDT methods may not detect all types of material defects, leading to potential gaps in inspections.
-
Regulatory Hurdles: Compliance with regional regulations and varying standards in different regions can pose challenges for businesses trying to operate internationally.
Regional Analysis
North America
North America dominates the Non-Destructive Testing and Inspection market, driven by strict regulatory standards and widespread adoption of advanced technologies. The U.S. accounts for a significant share of the market, particularly in aerospace, automotive, and energy sectors. The North American market size was estimated at USD 1.91 billion in 2024, with a growth rate of 4.97% during the forecast period.
Europe
Europe is a major player, particularly in aerospace, automotive, and energy sectors. Countries such as Germany, France, and the UK are key contributors, with substantial investments in NDT technologies. The European market is also expanding due to the demand for NDT services in the public infrastructure sector.
Asia-Pacific
Asia-Pacific is witnessing rapid growth in the Non-Destructive Testing market, primarily due to industrialization in countries like China, India, and Japan. The region is increasingly adopting NDT techniques across sectors like automotive, oil and gas, and manufacturing.
South America
South America presents a developing market with increasing industrialization, particularly in Brazil and Argentina. There is significant demand for NDT services in oil and gas exploration and infrastructure development.
Middle East & Africa
In the Middle East and Africa, the oil and gas sector drives the demand for NDT services, with countries like Saudi Arabia and the UAE investing in safety and infrastructure maintenance. The region is expected to grow steadily in the coming years.
Competitor Analysis (in brief)
Several key players dominate the global Non-Destructive Testing and Inspection market:
-
General Electric: A leader in NDT equipment and services, GE offers a broad range of solutions, including ultrasound and eddy current testing.
-
Mistras Group Inc.: Known for providing advanced asset protection and testing services across multiple sectors, Mistras is a major player in the market.
-
Olympus Corporation: Olympus specializes in ultrasonic and industrial inspection systems, contributing significantly to the NDT market.
-
Ashtead Technology Inc.: A major provider of inspection and testing services, Ashtead has a strong presence in the offshore and oil and gas sectors.
-
Magnaflux Corporation: Magnaflux focuses on non-destructive testing equipment and services, with a strong emphasis on magnetic particle testing and ultrasonic inspection.
These companies maintain a competitive edge through technological advancements, global expansion, and strategic partnerships.
Global Non-Destructive Testing and Inspection Market: Market Segmentation Analysis
This report provides a deep insight into the global Non-Destructive Testing and Inspection market, covering all its essential aspects. This ranges from a macro overview of the market to micro details of the market size, competitive landscape, development trend, niche market, key market drivers and challenges, SWOT analysis, value chain analysis, etc.
The analysis helps the reader to shape the competition within the industries and strategies for the competitive environment to enhance the potential profit. Furthermore, it provides a simple framework for evaluating and assessing the position of the business organization. The report structure also focuses on the competitive landscape of the Global Non-Destructive Testing and Inspection Market. This report introduces in detail the market share, market performance, product situation, operation situation, etc., of the main players, which helps the readers in the industry to identify the main competitors and deeply understand the competition pattern of the market.
In a word, this report is a must-read for industry players, investors, researchers, consultants, business strategists, and all those who have any kind of stake or are planning to foray into the Non-Destructive Testing and Inspection market in any manner.
Market Segmentation (by Application)
-
Manufacturing
-
Oil and Gas
-
Aerospace
-
Public Infrastructure
-
Automotive
-
Power Generation
-
Others Verticals
Market Segmentation (by Type)
Key Company
Geographic Segmentation
-
North America (USA, Canada, Mexico)
-
Europe (Germany, UK, France, Russia, Italy, Rest of Europe)
-
Asia-Pacific (China, Japan, South Korea, India, Southeast Asia, Rest of Asia-Pacific)
-
South America (Brazil, Argentina, Columbia, Rest of South America)
-
The Middle East and Africa (Saudi Arabia, UAE, Egypt, Nigeria, South Africa, Rest of MEA)
FAQ Section
What is the current market size of Non-Destructive Testing and Inspection?
- The current market size of Non-Destructive Testing and Inspection is estimated at USD 6.64 billion in 2024 and projected to reach USD 11.03 billion by 2032.
Which are the key companies operating in the Non-Destructive Testing and Inspection market?
- Key companies include General Electric, Mistras Group Inc., Olympus Corporation, Ashtead Technology Inc., Nikon Metrology Inc., Magnaflux Corporation, Zetec Inc., and many more.
What are the key growth drivers in the Non-Destructive Testing and Inspection market?
- Drivers include advancements in technology, increasing safety standards, regulatory compliance, and the growing demand for equipment rental services and maintenance.
Which regions dominate the Non-Destructive Testing and Inspection market?
- North America, Europe, and Asia-Pacific dominate the market, with North America holding a significant share due to strict safety regulations and technological advancements.
What are the emerging trends in the Non-Destructive Testing and Inspection market?
- Emerging trends include the integration of AI and automation, the growing demand for equipment rental services, and the increasing adoption of NDT in emerging markets.
Key Benefits of This Market Research:
-
Industry drivers, restraints, and opportunities covered in the study
-
Neutral perspective on the market performance
-
Recent industry trends and developments
-
Competitive landscape & strategies of key players
-
Potential & niche segments and regions exhibiting promising growth covered
-
Historical, current, and projected market size, in terms of value
-
In-depth analysis of the Non-Destructive Testing and Inspection Market
-
Overview of the regional outlook of the Non-Destructive Testing and Inspection Market:
Key Reasons to Buy this Report:
-
Access to date statistics compiled by our researchers. These provide you with historical and forecast data, which is analyzed to tell you why your market is set to change
-
This enables you to anticipate market changes to remain ahead of your competitors
-
You will be able to copy data from the Excel spreadsheet straight into your marketing plans, business presentations, or other strategic documents
-
The concise analysis, clear graph, and table format will enable you to pinpoint the information you require quickly
-
Provision of market value data for each segment and sub-segment
-
Indicates the region and segment that is expected to witness the fastest growth as well as to dominate the market
-
Analysis by geography highlighting the consumption of the product/service in the region as well as indicating the factors that are affecting the market within each region
-
Competitive landscape which incorporates the market ranking of the major players, along with new service/product launches, partnerships, business expansions, and acquisitions in the past five years of companies profiled
-
Extensive company profiles comprising of company overview, company insights, product benchmarking, and SWOT analysis for the major market players
-
The current as well as the future market outlook of the industry concerning recent developments which involve growth opportunities and drivers as well as challenges and restraints of both emerging as well as developed regions
-
Includes in-depth analysis of the market from various perspectives through Porter
TABLE OF CONTENTS
Table of Contents
1 Research Methodology and Statistical Scope
1.1 Market Definition and Statistical Scope of Non-Destructive Testing and Inspection
1.2 Key Market Segments
1.2.1 Non-Destructive Testing and Inspection Segment by Type
1.2.2 Non-Destructive Testing and Inspection Segment by Application
1.3 Methodology & Sources of Information
1.3.1 Research Methodology
1.3.2 Research Process
1.3.3 Market Breakdown and Data Triangulation
1.3.4 Base Year
1.3.5 Report Assumptions & Caveats
2 Non-Destructive Testing and Inspection Market Overview
2.1 Global Market Overview
2.1.1 Global Non-Destructive Testing and Inspection Market Size (M USD) Estimates and Forecasts (2019-2032)
2.1.2 Global Non-Destructive Testing and Inspection Sales Estimates and Forecasts (2019-2032)
2.2 Market Segment Executive Summary
2.3 Global Market Size by Region
3 Non-Destructive Testing and Inspection Market Competitive Landscape
3.1 Global Non-Destructive Testing and Inspection Sales by Manufacturers (2019-2025)
3.2 Global Non-Destructive Testing and Inspection Revenue Market Share by Manufacturers (2019-2025)
3.3 Non-Destructive Testing and Inspection Market Share by Company Type (Tier 1, Tier 2, and Tier 3)
3.4 Global Non-Destructive Testing and Inspection Average Price by Manufacturers (2019-2025)
3.5 Manufacturers Non-Destructive Testing and Inspection Sales Sites, Area Served, Product Type
3.6 Non-Destructive Testing and Inspection Market Competitive Situation and Trends
3.6.1 Non-Destructive Testing and Inspection Market Concentration Rate
3.6.2 Global 5 and 10 Largest Non-Destructive Testing and Inspection Players Market Share by Revenue
3.6.3 Mergers & Acquisitions, Expansion
4 Non-Destructive Testing and Inspection Industry Chain Analysis
4.1 Non-Destructive Testing and Inspection Industry Chain Analysis
4.2 Market Overview of Key Raw Materials
4.3 Midstream Market Analysis
4.4 Downstream Customer Analysis
5 The Development and Dynamics of Non-Destructive Testing and Inspection Market
5.1 Key Development Trends
5.2 Driving Factors
5.3 Market Challenges
5.4 Market Restraints
5.5 Industry News
5.5.1 New Product Developments
5.5.2 Mergers & Acquisitions
5.5.3 Expansions
5.5.4 Collaboration/Supply Contracts
5.6 Industry Policies
6 Non-Destructive Testing and Inspection Market Segmentation by Type
6.1 Evaluation Matrix of Segment Market Development Potential (Type)
6.2 Global Non-Destructive Testing and Inspection Sales Market Share by Type (2019-2025)
6.3 Global Non-Destructive Testing and Inspection Market Size Market Share by Type (2019-2025)
6.4 Global Non-Destructive Testing and Inspection Price by Type (2019-2025)
7 Non-Destructive Testing and Inspection Market Segmentation by Application
7.1 Evaluation Matrix of Segment Market Development Potential (Application)
7.2 Global Non-Destructive Testing and Inspection Market Sales by Application (2019-2025)
7.3 Global Non-Destructive Testing and Inspection Market Size (M USD) by Application (2019-2025)
7.4 Global Non-Destructive Testing and Inspection Sales Growth Rate by Application (2019-2025)
8 Non-Destructive Testing and Inspection Market Consumption by Region
8.1 Global Non-Destructive Testing and Inspection Sales by Region
8.1.1 Global Non-Destructive Testing and Inspection Sales by Region
8.1.2 Global Non-Destructive Testing and Inspection Sales Market Share by Region
8.2 North America
8.2.1 North America Non-Destructive Testing and Inspection Sales by Country
8.2.2 U.S.
8.2.3 Canada
8.2.4 Mexico
8.3 Europe
8.3.1 Europe Non-Destructive Testing and Inspection Sales by Country
8.3.2 Germany
8.3.3 France
8.3.4 U.K.
8.3.5 Italy
8.3.6 Russia
8.4 Asia Pacific
8.4.1 Asia Pacific Non-Destructive Testing and Inspection Sales by Region
8.4.2 China
8.4.3 Japan
8.4.4 South Korea
8.4.5 India
8.4.6 Southeast Asia
8.5 South America
8.5.1 South America Non-Destructive Testing and Inspection Sales by Country
8.5.2 Brazil
8.5.3 Argentina
8.5.4 Columbia
8.6 Middle East and Africa
8.6.1 Middle East and Africa Non-Destructive Testing and Inspection Sales by Region
8.6.2 Saudi Arabia
8.6.3 UAE
8.6.4 Egypt
8.6.5 Nigeria
8.6.6 South Africa
9 Non-Destructive Testing and Inspection Market Production by Region
9.1 Global Production of Non-Destructive Testing and Inspection by Region (2019-2025)
9.2 Global Non-Destructive Testing and Inspection Revenue Market Share by Region (2019-2025)
9.3 Global Non-Destructive Testing and Inspection Production, Revenue, Price and Gross Margin (2019-2025)
9.4 North America Non-Destructive Testing and Inspection Production
9.4.1 North America Non-Destructive Testing and Inspection Production Growth Rate (2019-2025)
9.4.2 North America Non-Destructive Testing and Inspection Production, Revenue, Price and Gross Margin (2019-2025)
9.5 Europe Non-Destructive Testing and Inspection Production
9.5.1 Europe Non-Destructive Testing and Inspection Production Growth Rate (2019-2025)
9.5.2 Europe Non-Destructive Testing and Inspection Production, Revenue, Price and Gross Margin (2019-2025)
9.6 Japan Non-Destructive Testing and Inspection Production (2019-2025)
9.6.1 Japan Non-Destructive Testing and Inspection Production Growth Rate (2019-2025)
9.6.2 Japan Non-Destructive Testing and Inspection Production, Revenue, Price and Gross Margin (2019-2025)
9.7 China Non-Destructive Testing and Inspection Production (2019-2025)
9.7.1 China Non-Destructive Testing and Inspection Production Growth Rate (2019-2025)
9.7.2 China Non-Destructive Testing and Inspection Production, Revenue, Price and Gross Margin (2019-2025)
10 Key Companies Profile
10.1 General Electric
10.1.1 General Electric Non-Destructive Testing and Inspection Basic Information
10.1.2 General Electric Non-Destructive Testing and Inspection Product Overview
10.1.3 General Electric Non-Destructive Testing and Inspection Product Market Performance
10.1.4 General Electric Business Overview
10.1.5 General Electric Non-Destructive Testing and Inspection SWOT Analysis
10.1.6 General Electric Recent Developments
10.2 Mistras Group Inc.
10.2.1 Mistras Group Inc. Non-Destructive Testing and Inspection Basic Information
10.2.2 Mistras Group Inc. Non-Destructive Testing and Inspection Product Overview
10.2.3 Mistras Group Inc. Non-Destructive Testing and Inspection Product Market Performance
10.2.4 Mistras Group Inc. Business Overview
10.2.5 Mistras Group Inc. Non-Destructive Testing and Inspection SWOT Analysis
10.2.6 Mistras Group Inc. Recent Developments
10.3 Olympus Corporation
10.3.1 Olympus Corporation Non-Destructive Testing and Inspection Basic Information
10.3.2 Olympus Corporation Non-Destructive Testing and Inspection Product Overview
10.3.3 Olympus Corporation Non-Destructive Testing and Inspection Product Market Performance
10.3.4 Olympus Corporation Non-Destructive Testing and Inspection SWOT Analysis
10.3.5 Olympus Corporation Business Overview
10.3.6 Olympus Corporation Recent Developments
10.4 Ashtead Technology Inc.
10.4.1 Ashtead Technology Inc. Non-Destructive Testing and Inspection Basic Information
10.4.2 Ashtead Technology Inc. Non-Destructive Testing and Inspection Product Overview
10.4.3 Ashtead Technology Inc. Non-Destructive Testing and Inspection Product Market Performance
10.4.4 Ashtead Technology Inc. Business Overview
10.4.5 Ashtead Technology Inc. Recent Developments
10.5 Nikon Metrology Inc.
10.5.1 Nikon Metrology Inc. Non-Destructive Testing and Inspection Basic Information
10.5.2 Nikon Metrology Inc. Non-Destructive Testing and Inspection Product Overview
10.5.3 Nikon Metrology Inc. Non-Destructive Testing and Inspection Product Market Performance
10.5.4 Nikon Metrology Inc. Business Overview
10.5.5 Nikon Metrology Inc. Recent Developments
10.6 Magnaflux Corporation
10.6.1 Magnaflux Corporation Non-Destructive Testing and Inspection Basic Information
10.6.2 Magnaflux Corporation Non-Destructive Testing and Inspection Product Overview
10.6.3 Magnaflux Corporation Non-Destructive Testing and Inspection Product Market Performance
10.6.4 Magnaflux Corporation Business Overview
10.6.5 Magnaflux Corporation Recent Developments
10.7 Zetec Inc.
10.7.1 Zetec Inc. Non-Destructive Testing and Inspection Basic Information
10.7.2 Zetec Inc. Non-Destructive Testing and Inspection Product Overview
10.7.3 Zetec Inc. Non-Destructive Testing and Inspection Product Market Performance
10.7.4 Zetec Inc. Business Overview
10.7.5 Zetec Inc. Recent Developments
10.8 Eddyfi NDT Inc.
10.8.1 Eddyfi NDT Inc. Non-Destructive Testing and Inspection Basic Information
10.8.2 Eddyfi NDT Inc. Non-Destructive Testing and Inspection Product Overview
10.8.3 Eddyfi NDT Inc. Non-Destructive Testing and Inspection Product Market Performance
10.8.4 Eddyfi NDT Inc. Business Overview
10.8.5 Eddyfi NDT Inc. Recent Developments
10.9 Yxlon International GmbH
10.9.1 Yxlon International GmbH Non-Destructive Testing and Inspection Basic Information
10.9.2 Yxlon International GmbH Non-Destructive Testing and Inspection Product Overview
10.9.3 Yxlon International GmbH Non-Destructive Testing and Inspection Product Market Performance
10.9.4 Yxlon International GmbH Business Overview
10.9.5 Yxlon International GmbH Recent Developments
10.10 Fischer Technology Inc.
10.10.1 Fischer Technology Inc. Non-Destructive Testing and Inspection Basic Information
10.10.2 Fischer Technology Inc. Non-Destructive Testing and Inspection Product Overview
10.10.3 Fischer Technology Inc. Non-Destructive Testing and Inspection Product Market Performance
10.10.4 Fischer Technology Inc. Business Overview
10.10.5 Fischer Technology Inc. Recent Developments
10.11 Sonatest Ltd.
10.11.1 Sonatest Ltd. Non-Destructive Testing and Inspection Basic Information
10.11.2 Sonatest Ltd. Non-Destructive Testing and Inspection Product Overview
10.11.3 Sonatest Ltd. Non-Destructive Testing and Inspection Product Market Performance
10.11.4 Sonatest Ltd. Business Overview
10.11.5 Sonatest Ltd. Recent Developments
10.12 NDT Global GmbH and Co. Kg
10.12.1 NDT Global GmbH and Co. Kg Non-Destructive Testing and Inspection Basic Information
10.12.2 NDT Global GmbH and Co. Kg Non-Destructive Testing and Inspection Product Overview
10.12.3 NDT Global GmbH and Co. Kg Non-Destructive Testing and Inspection Product Market Performance
10.12.4 NDT Global GmbH and Co. Kg Business Overview
10.12.5 NDT Global GmbH and Co. Kg Recent Developments
10.13 Td Williamson
10.13.1 Td Williamson Non-Destructive Testing and Inspection Basic Information
10.13.2 Td Williamson Non-Destructive Testing and Inspection Product Overview
10.13.3 Td Williamson Non-Destructive Testing and Inspection Product Market Performance
10.13.4 Td Williamson Business Overview
10.13.5 Td Williamson Recent Developments
10.14 Bosello High Technology Srl
10.14.1 Bosello High Technology Srl Non-Destructive Testing and Inspection Basic Information
10.14.2 Bosello High Technology Srl Non-Destructive Testing and Inspection Product Overview
10.14.3 Bosello High Technology Srl Non-Destructive Testing and Inspection Product Market Performance
10.14.4 Bosello High Technology Srl Business Overview
10.14.5 Bosello High Technology Srl Recent Developments
11 Non-Destructive Testing and Inspection Market Forecast by Region
11.1 Global Non-Destructive Testing and Inspection Market Size Forecast
11.2 Global Non-Destructive Testing and Inspection Market Forecast by Region
11.2.1 North America Market Size Forecast by Country
11.2.2 Europe Non-Destructive Testing and Inspection Market Size Forecast by Country
11.2.3 Asia Pacific Non-Destructive Testing and Inspection Market Size Forecast by Region
11.2.4 South America Non-Destructive Testing and Inspection Market Size Forecast by Country
11.2.5 Middle East and Africa Forecasted Consumption of Non-Destructive Testing and Inspection by Country
12 Forecast Market by Type and by Application (2025-2032)
12.1 Global Non-Destructive Testing and Inspection Market Forecast by Type (2025-2032)
12.1.1 Global Forecasted Sales of Non-Destructive Testing and Inspection by Type (2025-2032)
12.1.2 Global Non-Destructive Testing and Inspection Market Size Forecast by Type (2025-2032)
12.1.3 Global Forecasted Price of Non-Destructive Testing and Inspection by Type (2025-2032)
12.2 Global Non-Destructive Testing and Inspection Market Forecast by Application (2025-2032)
12.2.1 Global Non-Destructive Testing and Inspection Sales (K Units) Forecast by Application
12.2.2 Global Non-Destructive Testing and Inspection Market Size (M USD) Forecast by Application (2025-2032)
13 Conclusion and Key Findings
LIST OF TABLES & FIGURES
List of Tables
Table 1. Introduction of the Type
Table 2. Introduction of the Application
Table 3. Market Size (M USD) Segment Executive Summary
Table 4. Non-Destructive Testing and Inspection Market Size Comparison by Region (M USD)
Table 5. Global Non-Destructive Testing and Inspection Sales (K Units) by Manufacturers (2019-2025)
Table 6. Global Non-Destructive Testing and Inspection Sales Market Share by Manufacturers (2019-2025)
Table 7. Global Non-Destructive Testing and Inspection Revenue (M USD) by Manufacturers (2019-2025)
Table 8. Global Non-Destructive Testing and Inspection Revenue Share by Manufacturers (2019-2025)
Table 9. Company Type (Tier 1, Tier 2, and Tier 3) & (based on the Revenue in Non-Destructive Testing and Inspection as of 2022)
Table 10. Global Market Non-Destructive Testing and Inspection Average Price (USD/Unit) of Key Manufacturers (2019-2025)
Table 11. Manufacturers Non-Destructive Testing and Inspection Sales Sites and Area Served
Table 12. Manufacturers Non-Destructive Testing and Inspection Product Type
Table 13. Global Non-Destructive Testing and Inspection Manufacturers Market Concentration Ratio (CR5 and HHI)
Table 14. Mergers & Acquisitions, Expansion Plans
Table 15. Industry Chain Map of Non-Destructive Testing and Inspection
Table 16. Market Overview of Key Raw Materials
Table 17. Midstream Market Analysis
Table 18. Downstream Customer Analysis
Table 19. Key Development Trends
Table 20. Driving Factors
Table 21. Non-Destructive Testing and Inspection Market Challenges
Table 22. Global Non-Destructive Testing and Inspection Sales by Type (K Units)
Table 23. Global Non-Destructive Testing and Inspection Market Size by Type (M USD)
Table 24. Global Non-Destructive Testing and Inspection Sales (K Units) by Type (2019-2025)
Table 25. Global Non-Destructive Testing and Inspection Sales Market Share by Type (2019-2025)
Table 26. Global Non-Destructive Testing and Inspection Market Size (M USD) by Type (2019-2025)
Table 27. Global Non-Destructive Testing and Inspection Market Size Share by Type (2019-2025)
Table 28. Global Non-Destructive Testing and Inspection Price (USD/Unit) by Type (2019-2025)
Table 29. Global Non-Destructive Testing and Inspection Sales (K Units) by Application
Table 30. Global Non-Destructive Testing and Inspection Market Size by Application
Table 31. Global Non-Destructive Testing and Inspection Sales by Application (2019-2025) & (K Units)
Table 32. Global Non-Destructive Testing and Inspection Sales Market Share by Application (2019-2025)
Table 33. Global Non-Destructive Testing and Inspection Sales by Application (2019-2025) & (M USD)
Table 34. Global Non-Destructive Testing and Inspection Market Share by Application (2019-2025)
Table 35. Global Non-Destructive Testing and Inspection Sales Growth Rate by Application (2019-2025)
Table 36. Global Non-Destructive Testing and Inspection Sales by Region (2019-2025) & (K Units)
Table 37. Global Non-Destructive Testing and Inspection Sales Market Share by Region (2019-2025)
Table 38. North America Non-Destructive Testing and Inspection Sales by Country (2019-2025) & (K Units)
Table 39. Europe Non-Destructive Testing and Inspection Sales by Country (2019-2025) & (K Units)
Table 40. Asia Pacific Non-Destructive Testing and Inspection Sales by Region (2019-2025) & (K Units)
Table 41. South America Non-Destructive Testing and Inspection Sales by Country (2019-2025) & (K Units)
Table 42. Middle East and Africa Non-Destructive Testing and Inspection Sales by Region (2019-2025) & (K Units)
Table 43. Global Non-Destructive Testing and Inspection Production (K Units) by Region (2019-2025)
Table 44. Global Non-Destructive Testing and Inspection Revenue (US$ Million) by Region (2019-2025)
Table 45. Global Non-Destructive Testing and Inspection Revenue Market Share by Region (2019-2025)
Table 46. Global Non-Destructive Testing and Inspection Production (K Units), Revenue (US$ Million), Price (USD/Unit) and Gross Margin (2019-2025)
Table 47. North America Non-Destructive Testing and Inspection Production (K Units), Revenue (US$ Million), Price (USD/Unit) and Gross Margin (2019-2025)
Table 48. Europe Non-Destructive Testing and Inspection Production (K Units), Revenue (US$ Million), Price (USD/Unit) and Gross Margin (2019-2025)
Table 49. Japan Non-Destructive Testing and Inspection Production (K Units), Revenue (US$ Million), Price (USD/Unit) and Gross Margin (2019-2025)
Table 50. China Non-Destructive Testing and Inspection Production (K Units), Revenue (US$ Million), Price (USD/Unit) and Gross Margin (2019-2025)
Table 51. General Electric Non-Destructive Testing and Inspection Basic Information
Table 52. General Electric Non-Destructive Testing and Inspection Product Overview
Table 53. General Electric Non-Destructive Testing and Inspection Sales (K Units), Revenue (M USD), Price (USD/Unit) and Gross Margin (2019-2025)
Table 54. General Electric Business Overview
Table 55. General Electric Non-Destructive Testing and Inspection SWOT Analysis
Table 56. General Electric Recent Developments
Table 57. Mistras Group Inc. Non-Destructive Testing and Inspection Basic Information
Table 58. Mistras Group Inc. Non-Destructive Testing and Inspection Product Overview
Table 59. Mistras Group Inc. Non-Destructive Testing and Inspection Sales (K Units), Revenue (M USD), Price (USD/Unit) and Gross Margin (2019-2025)
Table 60. Mistras Group Inc. Business Overview
Table 61. Mistras Group Inc. Non-Destructive Testing and Inspection SWOT Analysis
Table 62. Mistras Group Inc. Recent Developments
Table 63. Olympus Corporation Non-Destructive Testing and Inspection Basic Information
Table 64. Olympus Corporation Non-Destructive Testing and Inspection Product Overview
Table 65. Olympus Corporation Non-Destructive Testing and Inspection Sales (K Units), Revenue (M USD), Price (USD/Unit) and Gross Margin (2019-2025)
Table 66. Olympus Corporation Non-Destructive Testing and Inspection SWOT Analysis
Table 67. Olympus Corporation Business Overview
Table 68. Olympus Corporation Recent Developments
Table 69. Ashtead Technology Inc. Non-Destructive Testing and Inspection Basic Information
Table 70. Ashtead Technology Inc. Non-Destructive Testing and Inspection Product Overview
Table 71. Ashtead Technology Inc. Non-Destructive Testing and Inspection Sales (K Units), Revenue (M USD), Price (USD/Unit) and Gross Margin (2019-2025)
Table 72. Ashtead Technology Inc. Business Overview
Table 73. Ashtead Technology Inc. Recent Developments
Table 74. Nikon Metrology Inc. Non-Destructive Testing and Inspection Basic Information
Table 75. Nikon Metrology Inc. Non-Destructive Testing and Inspection Product Overview
Table 76. Nikon Metrology Inc. Non-Destructive Testing and Inspection Sales (K Units), Revenue (M USD), Price (USD/Unit) and Gross Margin (2019-2025)
Table 77. Nikon Metrology Inc. Business Overview
Table 78. Nikon Metrology Inc. Recent Developments
Table 79. Magnaflux Corporation Non-Destructive Testing and Inspection Basic Information
Table 80. Magnaflux Corporation Non-Destructive Testing and Inspection Product Overview
Table 81. Magnaflux Corporation Non-Destructive Testing and Inspection Sales (K Units), Revenue (M USD), Price (USD/Unit) and Gross Margin (2019-2025)
Table 82. Magnaflux Corporation Business Overview
Table 83. Magnaflux Corporation Recent Developments
Table 84. Zetec Inc. Non-Destructive Testing and Inspection Basic Information
Table 85. Zetec Inc. Non-Destructive Testing and Inspection Product Overview
Table 86. Zetec Inc. Non-Destructive Testing and Inspection Sales (K Units), Revenue (M USD), Price (USD/Unit) and Gross Margin (2019-2025)
Table 87. Zetec Inc. Business Overview
Table 88. Zetec Inc. Recent Developments
Table 89. Eddyfi NDT Inc. Non-Destructive Testing and Inspection Basic Information
Table 90. Eddyfi NDT Inc. Non-Destructive Testing and Inspection Product Overview
Table 91. Eddyfi NDT Inc. Non-Destructive Testing and Inspection Sales (K Units), Revenue (M USD), Price (USD/Unit) and Gross Margin (2019-2025)
Table 92. Eddyfi NDT Inc. Business Overview
Table 93. Eddyfi NDT Inc. Recent Developments
Table 94. Yxlon International GmbH Non-Destructive Testing and Inspection Basic Information
Table 95. Yxlon International GmbH Non-Destructive Testing and Inspection Product Overview
Table 96. Yxlon International GmbH Non-Destructive Testing and Inspection Sales (K Units), Revenue (M USD), Price (USD/Unit) and Gross Margin (2019-2025)
Table 97. Yxlon International GmbH Business Overview
Table 98. Yxlon International GmbH Recent Developments
Table 99. Fischer Technology Inc. Non-Destructive Testing and Inspection Basic Information
Table 100. Fischer Technology Inc. Non-Destructive Testing and Inspection Product Overview
Table 101. Fischer Technology Inc. Non-Destructive Testing and Inspection Sales (K Units), Revenue (M USD), Price (USD/Unit) and Gross Margin (2019-2025)
Table 102. Fischer Technology Inc. Business Overview
Table 103. Fischer Technology Inc. Recent Developments
Table 104. Sonatest Ltd. Non-Destructive Testing and Inspection Basic Information
Table 105. Sonatest Ltd. Non-Destructive Testing and Inspection Product Overview
Table 106. Sonatest Ltd. Non-Destructive Testing and Inspection Sales (K Units), Revenue (M USD), Price (USD/Unit) and Gross Margin (2019-2025)
Table 107. Sonatest Ltd. Business Overview
Table 108. Sonatest Ltd. Recent Developments
Table 109. NDT Global GmbH and Co. Kg Non-Destructive Testing and Inspection Basic Information
Table 110. NDT Global GmbH and Co. Kg Non-Destructive Testing and Inspection Product Overview
Table 111. NDT Global GmbH and Co. Kg Non-Destructive Testing and Inspection Sales (K Units), Revenue (M USD), Price (USD/Unit) and Gross Margin (2019-2025)
Table 112. NDT Global GmbH and Co. Kg Business Overview
Table 113. NDT Global GmbH and Co. Kg Recent Developments
Table 114. Td Williamson Non-Destructive Testing and Inspection Basic Information
Table 115. Td Williamson Non-Destructive Testing and Inspection Product Overview
Table 116. Td Williamson Non-Destructive Testing and Inspection Sales (K Units), Revenue (M USD), Price (USD/Unit) and Gross Margin (2019-2025)
Table 117. Td Williamson Business Overview
Table 118. Td Williamson Recent Developments
Table 119. Bosello High Technology Srl Non-Destructive Testing and Inspection Basic Information
Table 120. Bosello High Technology Srl Non-Destructive Testing and Inspection Product Overview
Table 121. Bosello High Technology Srl Non-Destructive Testing and Inspection Sales (K Units), Revenue (M USD), Price (USD/Unit) and Gross Margin (2019-2025)
Table 122. Bosello High Technology Srl Business Overview
Table 123. Bosello High Technology Srl Recent Developments
Table 124. Global Non-Destructive Testing and Inspection Sales Forecast by Region (2025-2032) & (K Units)
Table 125. Global Non-Destructive Testing and Inspection Market Size Forecast by Region (2025-2032) & (M USD)
Table 126. North America Non-Destructive Testing and Inspection Sales Forecast by Country (2025-2032) & (K Units)
Table 127. North America Non-Destructive Testing and Inspection Market Size Forecast by Country (2025-2032) & (M USD)
Table 128. Europe Non-Destructive Testing and Inspection Sales Forecast by Country (2025-2032) & (K Units)
Table 129. Europe Non-Destructive Testing and Inspection Market Size Forecast by Country (2025-2032) & (M USD)
Table 130. Asia Pacific Non-Destructive Testing and Inspection Sales Forecast by Region (2025-2032) & (K Units)
Table 131. Asia Pacific Non-Destructive Testing and Inspection Market Size Forecast by Region (2025-2032) & (M USD)
Table 132. South America Non-Destructive Testing and Inspection Sales Forecast by Country (2025-2032) & (K Units)
Table 133. South America Non-Destructive Testing and Inspection Market Size Forecast by Country (2025-2032) & (M USD)
Table 134. Middle East and Africa Non-Destructive Testing and Inspection Consumption Forecast by Country (2025-2032) & (Units)
Table 135. Middle East and Africa Non-Destructive Testing and Inspection Market Size Forecast by Country (2025-2032) & (M USD)
Table 136. Global Non-Destructive Testing and Inspection Sales Forecast by Type (2025-2032) & (K Units)
Table 137. Global Non-Destructive Testing and Inspection Market Size Forecast by Type (2025-2032) & (M USD)
Table 138. Global Non-Destructive Testing and Inspection Price Forecast by Type (2025-2032) & (USD/Unit)
Table 139. Global Non-Destructive Testing and Inspection Sales (K Units) Forecast by Application (2025-2032)
Table 140. Global Non-Destructive Testing and Inspection Market Size Forecast by Application (2025-2032) & (M USD)
List of Figures
Figure 1. Product Picture of Non-Destructive Testing and Inspection
Figure 2. Data Triangulation
Figure 3. Key Caveats
Figure 4. Global Non-Destructive Testing and Inspection Market Size (M USD), 2019-2032
Figure 5. Global Non-Destructive Testing and Inspection Market Size (M USD) (2019-2032)
Figure 6. Global Non-Destructive Testing and Inspection Sales (K Units) & (2019-2032)
Figure 7. Evaluation Matrix of Segment Market Development Potential (Type)
Figure 8. Evaluation Matrix of Segment Market Development Potential (Application)
Figure 9. Evaluation Matrix of Regional Market Development Potential
Figure 10. Non-Destructive Testing and Inspection Market Size by Country (M USD)
Figure 11. Non-Destructive Testing and Inspection Sales Share by Manufacturers in 2023
Figure 12. Global Non-Destructive Testing and Inspection Revenue Share by Manufacturers in 2023
Figure 13. Non-Destructive Testing and Inspection Market Share by Company Type (Tier 1, Tier 2 and Tier 3): 2023
Figure 14. Global Market Non-Destructive Testing and Inspection Average Price (USD/Unit) of Key Manufacturers in 2023
Figure 15. The Global 5 and 10 Largest Players: Market Share by Non-Destructive Testing and Inspection Revenue in 2023
Figure 16. Evaluation Matrix of Segment Market Development Potential (Type)
Figure 17. Global Non-Destructive Testing and Inspection Market Share by Type
Figure 18. Sales Market Share of Non-Destructive Testing and Inspection by Type (2019-2025)
Figure 19. Sales Market Share of Non-Destructive Testing and Inspection by Type in 2023
Figure 20. Market Size Share of Non-Destructive Testing and Inspection by Type (2019-2025)
Figure 21. Market Size Market Share of Non-Destructive Testing and Inspection by Type in 2023
Figure 22. Evaluation Matrix of Segment Market Development Potential (Application)
Figure 23. Global Non-Destructive Testing and Inspection Market Share by Application
Figure 24. Global Non-Destructive Testing and Inspection Sales Market Share by Application (2019-2025)
Figure 25. Global Non-Destructive Testing and Inspection Sales Market Share by Application in 2023
Figure 26. Global Non-Destructive Testing and Inspection Market Share by Application (2019-2025)
Figure 27. Global Non-Destructive Testing and Inspection Market Share by Application in 2023
Figure 28. Global Non-Destructive Testing and Inspection Sales Growth Rate by Application (2019-2025)
Figure 29. Global Non-Destructive Testing and Inspection Sales Market Share by Region (2019-2025)
Figure 30. North America Non-Destructive Testing and Inspection Sales and Growth Rate (2019-2025) & (K Units)
Figure 31. North America Non-Destructive Testing and Inspection Sales Market Share by Country in 2023
Figure 32. U.S. Non-Destructive Testing and Inspection Sales and Growth Rate (2019-2025) & (K Units)
Figure 33. Canada Non-Destructive Testing and Inspection Sales (K Units) and Growth Rate (2019-2025)
Figure 34. Mexico Non-Destructive Testing and Inspection Sales (Units) and Growth Rate (2019-2025)
Figure 35. Europe Non-Destructive Testing and Inspection Sales and Growth Rate (2019-2025) & (K Units)
Figure 36. Europe Non-Destructive Testing and Inspection Sales Market Share by Country in 2023
Figure 37. Germany Non-Destructive Testing and Inspection Sales and Growth Rate (2019-2025) & (K Units)
Figure 38. France Non-Destructive Testing and Inspection Sales and Growth Rate (2019-2025) & (K Units)
Figure 39. U.K. Non-Destructive Testing and Inspection Sales and Growth Rate (2019-2025) & (K Units)
Figure 40. Italy Non-Destructive Testing and Inspection Sales and Growth Rate (2019-2025) & (K Units)
Figure 41. Russia Non-Destructive Testing and Inspection Sales and Growth Rate (2019-2025) & (K Units)
Figure 42. Asia Pacific Non-Destructive Testing and Inspection Sales and Growth Rate (K Units)
Figure 43. Asia Pacific Non-Destructive Testing and Inspection Sales Market Share by Region in 2023
Figure 44. China Non-Destructive Testing and Inspection Sales and Growth Rate (2019-2025) & (K Units)
Figure 45. Japan Non-Destructive Testing and Inspection Sales and Growth Rate (2019-2025) & (K Units)
Figure 46. South Korea Non-Destructive Testing and Inspection Sales and Growth Rate (2019-2025) & (K Units)
Figure 47. India Non-Destructive Testing and Inspection Sales and Growth Rate (2019-2025) & (K Units)
Figure 48. Southeast Asia Non-Destructive Testing and Inspection Sales and Growth Rate (2019-2025) & (K Units)
Figure 49. South America Non-Destructive Testing and Inspection Sales and Growth Rate (K Units)
Figure 50. South America Non-Destructive Testing and Inspection Sales Market Share by Country in 2023
Figure 51. Brazil Non-Destructive Testing and Inspection Sales and Growth Rate (2019-2025) & (K Units)
Figure 52. Argentina Non-Destructive Testing and Inspection Sales and Growth Rate (2019-2025) & (K Units)
Figure 53. Columbia Non-Destructive Testing and Inspection Sales and Growth Rate (2019-2025) & (K Units)
Figure 54. Middle East and Africa Non-Destructive Testing and Inspection Sales and Growth Rate (K Units)
Figure 55. Middle East and Africa Non-Destructive Testing and Inspection Sales Market Share by Region in 2023
Figure 56. Saudi Arabia Non-Destructive Testing and Inspection Sales and Growth Rate (2019-2025) & (K Units)
Figure 57. UAE Non-Destructive Testing and Inspection Sales and Growth Rate (2019-2025) & (K Units)
Figure 58. Egypt Non-Destructive Testing and Inspection Sales and Growth Rate (2019-2025) & (K Units)
Figure 59. Nigeria Non-Destructive Testing and Inspection Sales and Growth Rate (2019-2025) & (K Units)
Figure 60. South Africa Non-Destructive Testing and Inspection Sales and Growth Rate (2019-2025) & (K Units)
Figure 61. Global Non-Destructive Testing and Inspection Production Market Share by Region (2019-2025)
Figure 62. North America Non-Destructive Testing and Inspection Production (K Units) Growth Rate (2019-2025)
Figure 63. Europe Non-Destructive Testing and Inspection Production (K Units) Growth Rate (2019-2025)
Figure 64. Japan Non-Destructive Testing and Inspection Production (K Units) Growth Rate (2019-2025)
Figure 65. China Non-Destructive Testing and Inspection Production (K Units) Growth Rate (2019-2025)
Figure 66. Global Non-Destructive Testing and Inspection Sales Forecast by Volume (2019-2032) & (K Units)
Figure 67. Global Non-Destructive Testing and Inspection Market Size Forecast by Value (2019-2032) & (M USD)
Figure 68. Global Non-Destructive Testing and Inspection Sales Market Share Forecast by Type (2025-2032)
Figure 69. Global Non-Destructive Testing and Inspection Market Share Forecast by Type (2025-2032)
Figure 70. Global Non-Destructive Testing and Inspection Sales Forecast by Application (2025-2032)
Figure 71. Global Non-Destructive Testing and Inspection Market Share Forecast by Application (2025-2032)

