The global Display Test Equipment Market encompasses a range of specialized tools and technologies designed to assess and ensure the quality, performance, and functionality of display panels. These devices play a crucial role in the manufacturing process of various display technologies, including LCDs, LEDs, OLEDs, and other advanced display panels. The primary objective of display test equipment is to conduct optical, electrical, and functional tests that determine the precision, brightness, color accuracy, and overall performance of screens used in consumer electronics, automotive displays, and industrial applications.
Market Size
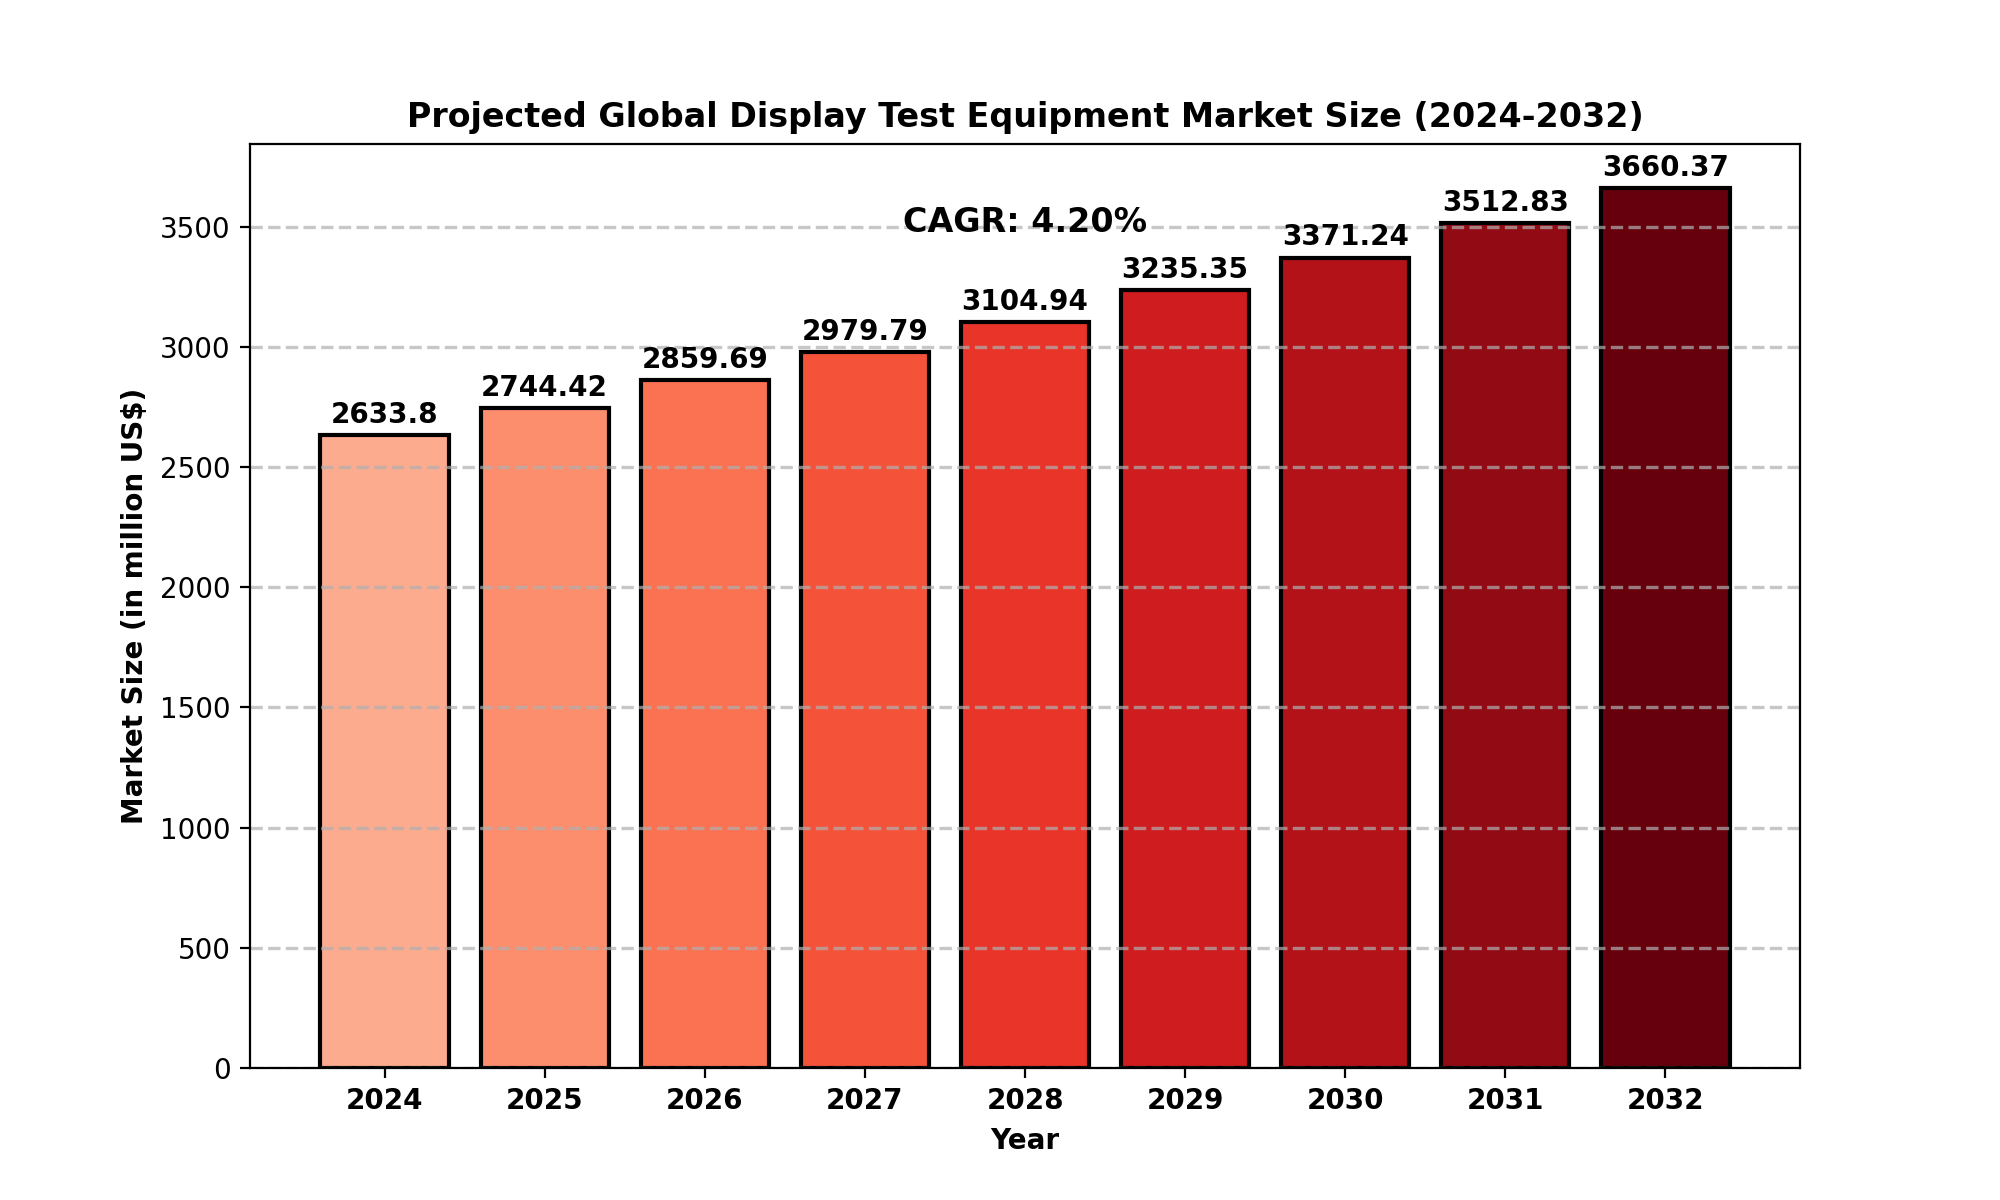
The Display Test Equipment Market was valued at approximately USD 2,633.80 million in 2024 and is projected to grow at a CAGR of 4.20%, reaching USD 3,660.37 million by 2032.
The North American market alone was estimated at USD 736.60 million in 2024, with a projected CAGR of 3.60% during the forecast period (2025-2032).
The increasing demand for high-quality displays in smartphones, televisions, automotive dashboards, and industrial monitors is a major driver for this market growth.
Market Dynamics
Drivers
-
Growing Demand for High-Resolution Displays: The increasing popularity of 4K, 8K, and OLED screens in smartphones, laptops, TVs, and gaming monitors is pushing manufacturers to enhance display quality, leading to higher investments in testing equipment.
-
Technological Advancements in Display Manufacturing: Innovations such as micro-LED and flexible displays require precise and accurate testing to meet consumer expectations.
-
Rising Adoption of Display Technology in the Automotive Sector: The integration of digital dashboards, heads-up displays (HUDs), and infotainment systems in modern vehicles boosts demand for display test equipment.
Restraints
-
High Initial Costs: The expensive nature of advanced optical and electrical testing equipment limits adoption, especially among small and mid-sized manufacturers.
-
Complexity in Testing Advanced Display Panels: The transition to mini-LED and micro-LED displays adds complexity to testing processes, requiring specialized and expensive equipment.
Opportunities
-
Expansion of Smart Devices & IoT Applications: The proliferation of smart home devices, wearables, and industrial IoT screens provides new opportunities for market expansion.
-
Increased R&D Investments: Continuous research into AI-powered display testing can further improve automation and accuracy in quality control processes.
Challenges
-
Rapid Technological Changes: Frequent advancements in display technology necessitate constant updates to test equipment, posing a challenge for manufacturers to keep up.
-
Global Supply Chain Disruptions: Semiconductor shortages and trade restrictions can impact the availability of essential components for test equipment.
Regional Analysis
North America
-
Market Size (2024): USD 736.60 million
-
Key Drivers: High adoption of premium displays in consumer electronics, strong presence of tech giants, and rising demand for automotive displays.
-
Major Players: HB Tech, KOH YOUNG, Chroma.
Europe
-
Key Markets: Germany, UK, France, and Italy.
-
Growth Factors: Growing automotive display applications and increasing investments in advanced display technology.
-
Market Trend: Rising adoption of OLED and micro-LED technologies.
Asia-Pacific
-
Dominant Region in Market Share: Led by China, Japan, South Korea, and India.
-
Growth Drivers: Presence of major display manufacturers (Samsung, LG, BOE), high consumer electronics demand, and government support for advanced manufacturing.
South America & MEA
-
Emerging Markets: Brazil, Argentina, Saudi Arabia, UAE, South Africa.
-
Growth Potential: Increasing smartphone penetration and government initiatives for industrial digitization.
Competitor Analysis
Key Companies
These companies focus on R&D, strategic partnerships, and product innovations to strengthen their market position. The competition revolves around automation, testing speed, and accuracy enhancements.
Market Segmentation
By Type
-
Array Process Testing Equipment
-
Cell Process Testing Equipment
-
Module Process Testing Equipment
By Application
-
LCDs Testing
-
LEDs Testing
Geographic Segmentation
-
North America (USA, Canada, Mexico)
-
Europe (Germany, UK, France, Russia, Italy, Rest of Europe)
-
Asia-Pacific (China, Japan, South Korea, India, Southeast Asia, Rest of Asia-Pacific)
-
South America (Brazil, Argentina, Columbia, Rest of South America)
-
Middle East & Africa (Saudi Arabia, UAE, Egypt, Nigeria, South Africa, Rest of MEA)
FAQ Section
1. What is the current market size of the Display Test Equipment Market?
The market was valued at USD 2,633.80 million in 2024 and is projected to reach USD 3,814.10 million by 2032, growing at a CAGR of 4.20%.
2. Which are the key companies operating in the Display Test Equipment Market?
Major players include HB Tech, KOH YOUNG, Chroma, KLA (Orbotech), Yang Electronic, and Suzhou HYC Technology.
3. What are the key growth drivers in the Display Test Equipment Market?
The primary growth drivers are increasing demand for high-resolution displays, advancements in display technologies, and rising adoption in automotive and industrial applications.
4. Which regions dominate the Display Test Equipment Market?
Asia-Pacific leads the market, followed by North America and Europe, due to the strong presence of display manufacturers and high demand for premium electronics.
5. What are the emerging trends in the Display Test Equipment Market?
- Key trends include the rise of AI-powered display testing, automation in quality control, and the shift towards micro-LED and OLED testing technologies.
Key Benefits of This Market Research:
- Industry drivers, restraints, and opportunities covered in the study
- Neutral perspective on the market performance
- Recent industry trends and developments
- Competitive landscape & strategies of key players
- Potential & niche segments and regions exhibiting promising growth covered
- Historical, current, and projected market size, in terms of value
- In-depth analysis of the Display Test Equipment Market
- Overview of the regional outlook of the Display Test Equipment Market:
Key Reasons to Buy this Report:
- Access to date statistics compiled by our researchers. These provide you with historical and forecast data, which is analyzed to tell you why your market is set to change
- This enables you to anticipate market changes to remain ahead of your competitors
- You will be able to copy data from the Excel spreadsheet straight into your marketing plans, business presentations, or other strategic documents
- The concise analysis, clear graph, and table format will enable you to pinpoint the information you require quickly
- Provision of market value data for each segment and sub-segment
- Indicates the region and segment that is expected to witness the fastest growth as well as to dominate the market
- Analysis by geography highlighting the consumption of the product/service in the region as well as indicating the factors that are affecting the market within each region
- Competitive landscape which incorporates the market ranking of the major players, along with new service/product launches, partnerships, business expansions, and acquisitions in the past five years of companies profiled
- Extensive company profiles comprising of company overview, company insights, product benchmarking, and SWOT analysis for the major market players
- The current as well as the future market outlook of the industry concerning recent developments which involve growth opportunities and drivers as well as challenges and restraints of both emerging as well as developed regions
- Includes in-depth analysis of the market from various perspectives through Porter
TABLE OF CONTENTS
Table of Contents
1 Research Methodology and Statistical Scope
1.1 Market Definition and Statistical Scope of Display Test Equipment
1.2 Key Market Segments
1.2.1 Display Test Equipment Segment by Type
1.2.2 Display Test Equipment Segment by Application
1.3 Methodology & Sources of Information
1.3.1 Research Methodology
1.3.2 Research Process
1.3.3 Market Breakdown and Data Triangulation
1.3.4 Base Year
1.3.5 Report Assumptions & Caveats
2 Display Test Equipment Market Overview
2.1 Global Market Overview
2.1.1 Global Display Test Equipment Market Size (M USD) Estimates and Forecasts (2019-2032)
2.1.2 Global Display Test Equipment Sales Estimates and Forecasts (2019-2032)
2.2 Market Segment Executive Summary
2.3 Global Market Size by Region
3 Display Test Equipment Market Competitive Landscape
3.1 Global Display Test Equipment Sales by Manufacturers (2019-2025)
3.2 Global Display Test Equipment Revenue Market Share by Manufacturers (2019-2025)
3.3 Display Test Equipment Market Share by Company Type (Tier 1, Tier 2, and Tier 3)
3.4 Global Display Test Equipment Average Price by Manufacturers (2019-2025)
3.5 Manufacturers Display Test Equipment Sales Sites, Area Served, Product Type
3.6 Display Test Equipment Market Competitive Situation and Trends
3.6.1 Display Test Equipment Market Concentration Rate
3.6.2 Global 5 and 10 Largest Display Test Equipment Players Market Share by Revenue
3.6.3 Mergers & Acquisitions, Expansion
4 Display Test Equipment Industry Chain Analysis
4.1 Display Test Equipment Industry Chain Analysis
4.2 Market Overview of Key Raw Materials
4.3 Midstream Market Analysis
4.4 Downstream Customer Analysis
5 The Development and Dynamics of Display Test Equipment Market
5.1 Key Development Trends
5.2 Driving Factors
5.3 Market Challenges
5.4 Market Restraints
5.5 Industry News
5.5.1 New Product Developments
5.5.2 Mergers & Acquisitions
5.5.3 Expansions
5.5.4 Collaboration/Supply Contracts
5.6 Industry Policies
6 Display Test Equipment Market Segmentation by Type
6.1 Evaluation Matrix of Segment Market Development Potential (Type)
6.2 Global Display Test Equipment Sales Market Share by Type (2019-2025)
6.3 Global Display Test Equipment Market Size Market Share by Type (2019-2025)
6.4 Global Display Test Equipment Price by Type (2019-2025)
7 Display Test Equipment Market Segmentation by Application
7.1 Evaluation Matrix of Segment Market Development Potential (Application)
7.2 Global Display Test Equipment Market Sales by Application (2019-2025)
7.3 Global Display Test Equipment Market Size (M USD) by Application (2019-2025)
7.4 Global Display Test Equipment Sales Growth Rate by Application (2019-2025)
8 Display Test Equipment Market Consumption by Region
8.1 Global Display Test Equipment Sales by Region
8.1.1 Global Display Test Equipment Sales by Region
8.1.2 Global Display Test Equipment Sales Market Share by Region
8.2 North America
8.2.1 North America Display Test Equipment Sales by Country
8.2.2 U.S.
8.2.3 Canada
8.2.4 Mexico
8.3 Europe
8.3.1 Europe Display Test Equipment Sales by Country
8.3.2 Germany
8.3.3 France
8.3.4 U.K.
8.3.5 Italy
8.3.6 Russia
8.4 Asia Pacific
8.4.1 Asia Pacific Display Test Equipment Sales by Region
8.4.2 China
8.4.3 Japan
8.4.4 South Korea
8.4.5 India
8.4.6 Southeast Asia
8.5 South America
8.5.1 South America Display Test Equipment Sales by Country
8.5.2 Brazil
8.5.3 Argentina
8.5.4 Columbia
8.6 Middle East and Africa
8.6.1 Middle East and Africa Display Test Equipment Sales by Region
8.6.2 Saudi Arabia
8.6.3 UAE
8.6.4 Egypt
8.6.5 Nigeria
8.6.6 South Africa
9 Display Test Equipment Market Production by Region
9.1 Global Production of Display Test Equipment by Region (2019-2025)
9.2 Global Display Test Equipment Revenue Market Share by Region (2019-2025)
9.3 Global Display Test Equipment Production, Revenue, Price and Gross Margin (2019-2025)
9.4 North America Display Test Equipment Production
9.4.1 North America Display Test Equipment Production Growth Rate (2019-2025)
9.4.2 North America Display Test Equipment Production, Revenue, Price and Gross Margin (2019-2025)
9.5 Europe Display Test Equipment Production
9.5.1 Europe Display Test Equipment Production Growth Rate (2019-2025)
9.5.2 Europe Display Test Equipment Production, Revenue, Price and Gross Margin (2019-2025)
9.6 Japan Display Test Equipment Production (2019-2025)
9.6.1 Japan Display Test Equipment Production Growth Rate (2019-2025)
9.6.2 Japan Display Test Equipment Production, Revenue, Price and Gross Margin (2019-2025)
9.7 China Display Test Equipment Production (2019-2025)
9.7.1 China Display Test Equipment Production Growth Rate (2019-2025)
9.7.2 China Display Test Equipment Production, Revenue, Price and Gross Margin (2019-2025)
10 Key Companies Profile
10.1 HB Tech
10.1.1 HB Tech Display Test Equipment Basic Information
10.1.2 HB Tech Display Test Equipment Product Overview
10.1.3 HB Tech Display Test Equipment Product Market Performance
10.1.4 HB Tech Business Overview
10.1.5 HB Tech Display Test Equipment SWOT Analysis
10.1.6 HB Tech Recent Developments
10.2 Yang Electronic
10.2.1 Yang Electronic Display Test Equipment Basic Information
10.2.2 Yang Electronic Display Test Equipment Product Overview
10.2.3 Yang Electronic Display Test Equipment Product Market Performance
10.2.4 Yang Electronic Business Overview
10.2.5 Yang Electronic Display Test Equipment SWOT Analysis
10.2.6 Yang Electronic Recent Developments
10.3 KOH YOUNG
10.3.1 KOH YOUNG Display Test Equipment Basic Information
10.3.2 KOH YOUNG Display Test Equipment Product Overview
10.3.3 KOH YOUNG Display Test Equipment Product Market Performance
10.3.4 KOH YOUNG Display Test Equipment SWOT Analysis
10.3.5 KOH YOUNG Business Overview
10.3.6 KOH YOUNG Recent Developments
10.4 ANI
10.4.1 ANI Display Test Equipment Basic Information
10.4.2 ANI Display Test Equipment Product Overview
10.4.3 ANI Display Test Equipment Product Market Performance
10.4.4 ANI Business Overview
10.4.5 ANI Recent Developments
10.5 KLA(Orbotech)
10.5.1 KLA(Orbotech) Display Test Equipment Basic Information
10.5.2 KLA(Orbotech) Display Test Equipment Product Overview
10.5.3 KLA(Orbotech) Display Test Equipment Product Market Performance
10.5.4 KLA(Orbotech) Business Overview
10.5.5 KLA(Orbotech) Recent Developments
10.6 V-Tech
10.6.1 V-Tech Display Test Equipment Basic Information
10.6.2 V-Tech Display Test Equipment Product Overview
10.6.3 V-Tech Display Test Equipment Product Market Performance
10.6.4 V-Tech Business Overview
10.6.5 V-Tech Recent Developments
10.7 Young Woo
10.7.1 Young Woo Display Test Equipment Basic Information
10.7.2 Young Woo Display Test Equipment Product Overview
10.7.3 Young Woo Display Test Equipment Product Market Performance
10.7.4 Young Woo Business Overview
10.7.5 Young Woo Recent Developments
10.8 Chroma
10.8.1 Chroma Display Test Equipment Basic Information
10.8.2 Chroma Display Test Equipment Product Overview
10.8.3 Chroma Display Test Equipment Product Market Performance
10.8.4 Chroma Business Overview
10.8.5 Chroma Recent Developments
10.9 Takano
10.9.1 Takano Display Test Equipment Basic Information
10.9.2 Takano Display Test Equipment Product Overview
10.9.3 Takano Display Test Equipment Product Market Performance
10.9.4 Takano Business Overview
10.9.5 Takano Recent Developments
10.10 Wuhan Jingce Electronic Group
10.10.1 Wuhan Jingce Electronic Group Display Test Equipment Basic Information
10.10.2 Wuhan Jingce Electronic Group Display Test Equipment Product Overview
10.10.3 Wuhan Jingce Electronic Group Display Test Equipment Product Market Performance
10.10.4 Wuhan Jingce Electronic Group Business Overview
10.10.5 Wuhan Jingce Electronic Group Recent Developments
10.11 Suzhou HYC Technology
10.11.1 Suzhou HYC Technology Display Test Equipment Basic Information
10.11.2 Suzhou HYC Technology Display Test Equipment Product Overview
10.11.3 Suzhou HYC Technology Display Test Equipment Product Market Performance
10.11.4 Suzhou HYC Technology Business Overview
10.11.5 Suzhou HYC Technology Recent Developments
10.12 Seichitech
10.12.1 Seichitech Display Test Equipment Basic Information
10.12.2 Seichitech Display Test Equipment Product Overview
10.12.3 Seichitech Display Test Equipment Product Market Performance
10.12.4 Seichitech Business Overview
10.12.5 Seichitech Recent Developments
10.13 LUSTER LightTech
10.13.1 LUSTER LightTech Display Test Equipment Basic Information
10.13.2 LUSTER LightTech Display Test Equipment Product Overview
10.13.3 LUSTER LightTech Display Test Equipment Product Market Performance
10.13.4 LUSTER LightTech Business Overview
10.13.5 LUSTER LightTech Recent Developments
10.14 Favite
10.14.1 Favite Display Test Equipment Basic Information
10.14.2 Favite Display Test Equipment Product Overview
10.14.3 Favite Display Test Equipment Product Market Performance
10.14.4 Favite Business Overview
10.14.5 Favite Recent Developments
10.15 Suzhou UB Precision
10.15.1 Suzhou UB Precision Display Test Equipment Basic Information
10.15.2 Suzhou UB Precision Display Test Equipment Product Overview
10.15.3 Suzhou UB Precision Display Test Equipment Product Market Performance
10.15.4 Suzhou UB Precision Business Overview
10.15.5 Suzhou UB Precision Recent Developments
10.16 Shenzhen SEICHI Technologies
10.16.1 Shenzhen SEICHI Technologies Display Test Equipment Basic Information
10.16.2 Shenzhen SEICHI Technologies Display Test Equipment Product Overview
10.16.3 Shenzhen SEICHI Technologies Display Test Equipment Product Market Performance
10.16.4 Shenzhen SEICHI Technologies Business Overview
10.16.5 Shenzhen SEICHI Technologies Recent Developments
10.17 Casivision Technology
10.17.1 Casivision Technology Display Test Equipment Basic Information
10.17.2 Casivision Technology Display Test Equipment Product Overview
10.17.3 Casivision Technology Display Test Equipment Product Market Performance
10.17.4 Casivision Technology Business Overview
10.17.5 Casivision Technology Recent Developments
11 Display Test Equipment Market Forecast by Region
11.1 Global Display Test Equipment Market Size Forecast
11.2 Global Display Test Equipment Market Forecast by Region
11.2.1 North America Market Size Forecast by Country
11.2.2 Europe Display Test Equipment Market Size Forecast by Country
11.2.3 Asia Pacific Display Test Equipment Market Size Forecast by Region
11.2.4 South America Display Test Equipment Market Size Forecast by Country
11.2.5 Middle East and Africa Forecasted Consumption of Display Test Equipment by Country
12 Forecast Market by Type and by Application (2025-2032)
12.1 Global Display Test Equipment Market Forecast by Type (2025-2032)
12.1.1 Global Forecasted Sales of Display Test Equipment by Type (2025-2032)
12.1.2 Global Display Test Equipment Market Size Forecast by Type (2025-2032)
12.1.3 Global Forecasted Price of Display Test Equipment by Type (2025-2032)
12.2 Global Display Test Equipment Market Forecast by Application (2025-2032)
12.2.1 Global Display Test Equipment Sales (K Units) Forecast by Application
12.2.2 Global Display Test Equipment Market Size (M USD) Forecast by Application (2025-2032)
13 Conclusion and Key Findings
LIST OF TABLES & FIGURES
List of Tables
Table 1. Introduction of the Type
Table 2. Introduction of the Application
Table 3. Market Size (M USD) Segment Executive Summary
Table 4. Display Test Equipment Market Size Comparison by Region (M USD)
Table 5. Global Display Test Equipment Sales (K Units) by Manufacturers (2019-2025)
Table 6. Global Display Test Equipment Sales Market Share by Manufacturers (2019-2025)
Table 7. Global Display Test Equipment Revenue (M USD) by Manufacturers (2019-2025)
Table 8. Global Display Test Equipment Revenue Share by Manufacturers (2019-2025)
Table 9. Company Type (Tier 1, Tier 2, and Tier 3) & (based on the Revenue in Display Test Equipment as of 2022)
Table 10. Global Market Display Test Equipment Average Price (USD/Unit) of Key Manufacturers (2019-2025)
Table 11. Manufacturers Display Test Equipment Sales Sites and Area Served
Table 12. Manufacturers Display Test Equipment Product Type
Table 13. Global Display Test Equipment Manufacturers Market Concentration Ratio (CR5 and HHI)
Table 14. Mergers & Acquisitions, Expansion Plans
Table 15. Industry Chain Map of Display Test Equipment
Table 16. Market Overview of Key Raw Materials
Table 17. Midstream Market Analysis
Table 18. Downstream Customer Analysis
Table 19. Key Development Trends
Table 20. Driving Factors
Table 21. Display Test Equipment Market Challenges
Table 22. Global Display Test Equipment Sales by Type (K Units)
Table 23. Global Display Test Equipment Market Size by Type (M USD)
Table 24. Global Display Test Equipment Sales (K Units) by Type (2019-2025)
Table 25. Global Display Test Equipment Sales Market Share by Type (2019-2025)
Table 26. Global Display Test Equipment Market Size (M USD) by Type (2019-2025)
Table 27. Global Display Test Equipment Market Size Share by Type (2019-2025)
Table 28. Global Display Test Equipment Price (USD/Unit) by Type (2019-2025)
Table 29. Global Display Test Equipment Sales (K Units) by Application
Table 30. Global Display Test Equipment Market Size by Application
Table 31. Global Display Test Equipment Sales by Application (2019-2025) & (K Units)
Table 32. Global Display Test Equipment Sales Market Share by Application (2019-2025)
Table 33. Global Display Test Equipment Sales by Application (2019-2025) & (M USD)
Table 34. Global Display Test Equipment Market Share by Application (2019-2025)
Table 35. Global Display Test Equipment Sales Growth Rate by Application (2019-2025)
Table 36. Global Display Test Equipment Sales by Region (2019-2025) & (K Units)
Table 37. Global Display Test Equipment Sales Market Share by Region (2019-2025)
Table 38. North America Display Test Equipment Sales by Country (2019-2025) & (K Units)
Table 39. Europe Display Test Equipment Sales by Country (2019-2025) & (K Units)
Table 40. Asia Pacific Display Test Equipment Sales by Region (2019-2025) & (K Units)
Table 41. South America Display Test Equipment Sales by Country (2019-2025) & (K Units)
Table 42. Middle East and Africa Display Test Equipment Sales by Region (2019-2025) & (K Units)
Table 43. Global Display Test Equipment Production (K Units) by Region (2019-2025)
Table 44. Global Display Test Equipment Revenue (US$ Million) by Region (2019-2025)
Table 45. Global Display Test Equipment Revenue Market Share by Region (2019-2025)
Table 46. Global Display Test Equipment Production (K Units), Revenue (US$ Million), Price (USD/Unit) and Gross Margin (2019-2025)
Table 47. North America Display Test Equipment Production (K Units), Revenue (US$ Million), Price (USD/Unit) and Gross Margin (2019-2025)
Table 48. Europe Display Test Equipment Production (K Units), Revenue (US$ Million), Price (USD/Unit) and Gross Margin (2019-2025)
Table 49. Japan Display Test Equipment Production (K Units), Revenue (US$ Million), Price (USD/Unit) and Gross Margin (2019-2025)
Table 50. China Display Test Equipment Production (K Units), Revenue (US$ Million), Price (USD/Unit) and Gross Margin (2019-2025)
Table 51. HB Tech Display Test Equipment Basic Information
Table 52. HB Tech Display Test Equipment Product Overview
Table 53. HB Tech Display Test Equipment Sales (K Units), Revenue (M USD), Price (USD/Unit) and Gross Margin (2019-2025)
Table 54. HB Tech Business Overview
Table 55. HB Tech Display Test Equipment SWOT Analysis
Table 56. HB Tech Recent Developments
Table 57. Yang Electronic Display Test Equipment Basic Information
Table 58. Yang Electronic Display Test Equipment Product Overview
Table 59. Yang Electronic Display Test Equipment Sales (K Units), Revenue (M USD), Price (USD/Unit) and Gross Margin (2019-2025)
Table 60. Yang Electronic Business Overview
Table 61. Yang Electronic Display Test Equipment SWOT Analysis
Table 62. Yang Electronic Recent Developments
Table 63. KOH YOUNG Display Test Equipment Basic Information
Table 64. KOH YOUNG Display Test Equipment Product Overview
Table 65. KOH YOUNG Display Test Equipment Sales (K Units), Revenue (M USD), Price (USD/Unit) and Gross Margin (2019-2025)
Table 66. KOH YOUNG Display Test Equipment SWOT Analysis
Table 67. KOH YOUNG Business Overview
Table 68. KOH YOUNG Recent Developments
Table 69. ANI Display Test Equipment Basic Information
Table 70. ANI Display Test Equipment Product Overview
Table 71. ANI Display Test Equipment Sales (K Units), Revenue (M USD), Price (USD/Unit) and Gross Margin (2019-2025)
Table 72. ANI Business Overview
Table 73. ANI Recent Developments
Table 74. KLA(Orbotech) Display Test Equipment Basic Information
Table 75. KLA(Orbotech) Display Test Equipment Product Overview
Table 76. KLA(Orbotech) Display Test Equipment Sales (K Units), Revenue (M USD), Price (USD/Unit) and Gross Margin (2019-2025)
Table 77. KLA(Orbotech) Business Overview
Table 78. KLA(Orbotech) Recent Developments
Table 79. V-Tech Display Test Equipment Basic Information
Table 80. V-Tech Display Test Equipment Product Overview
Table 81. V-Tech Display Test Equipment Sales (K Units), Revenue (M USD), Price (USD/Unit) and Gross Margin (2019-2025)
Table 82. V-Tech Business Overview
Table 83. V-Tech Recent Developments
Table 84. Young Woo Display Test Equipment Basic Information
Table 85. Young Woo Display Test Equipment Product Overview
Table 86. Young Woo Display Test Equipment Sales (K Units), Revenue (M USD), Price (USD/Unit) and Gross Margin (2019-2025)
Table 87. Young Woo Business Overview
Table 88. Young Woo Recent Developments
Table 89. Chroma Display Test Equipment Basic Information
Table 90. Chroma Display Test Equipment Product Overview
Table 91. Chroma Display Test Equipment Sales (K Units), Revenue (M USD), Price (USD/Unit) and Gross Margin (2019-2025)
Table 92. Chroma Business Overview
Table 93. Chroma Recent Developments
Table 94. Takano Display Test Equipment Basic Information
Table 95. Takano Display Test Equipment Product Overview
Table 96. Takano Display Test Equipment Sales (K Units), Revenue (M USD), Price (USD/Unit) and Gross Margin (2019-2025)
Table 97. Takano Business Overview
Table 98. Takano Recent Developments
Table 99. Wuhan Jingce Electronic Group Display Test Equipment Basic Information
Table 100. Wuhan Jingce Electronic Group Display Test Equipment Product Overview
Table 101. Wuhan Jingce Electronic Group Display Test Equipment Sales (K Units), Revenue (M USD), Price (USD/Unit) and Gross Margin (2019-2025)
Table 102. Wuhan Jingce Electronic Group Business Overview
Table 103. Wuhan Jingce Electronic Group Recent Developments
Table 104. Suzhou HYC Technology Display Test Equipment Basic Information
Table 105. Suzhou HYC Technology Display Test Equipment Product Overview
Table 106. Suzhou HYC Technology Display Test Equipment Sales (K Units), Revenue (M USD), Price (USD/Unit) and Gross Margin (2019-2025)
Table 107. Suzhou HYC Technology Business Overview
Table 108. Suzhou HYC Technology Recent Developments
Table 109. Seichitech Display Test Equipment Basic Information
Table 110. Seichitech Display Test Equipment Product Overview
Table 111. Seichitech Display Test Equipment Sales (K Units), Revenue (M USD), Price (USD/Unit) and Gross Margin (2019-2025)
Table 112. Seichitech Business Overview
Table 113. Seichitech Recent Developments
Table 114. LUSTER LightTech Display Test Equipment Basic Information
Table 115. LUSTER LightTech Display Test Equipment Product Overview
Table 116. LUSTER LightTech Display Test Equipment Sales (K Units), Revenue (M USD), Price (USD/Unit) and Gross Margin (2019-2025)
Table 117. LUSTER LightTech Business Overview
Table 118. LUSTER LightTech Recent Developments
Table 119. Favite Display Test Equipment Basic Information
Table 120. Favite Display Test Equipment Product Overview
Table 121. Favite Display Test Equipment Sales (K Units), Revenue (M USD), Price (USD/Unit) and Gross Margin (2019-2025)
Table 122. Favite Business Overview
Table 123. Favite Recent Developments
Table 124. Suzhou UB Precision Display Test Equipment Basic Information
Table 125. Suzhou UB Precision Display Test Equipment Product Overview
Table 126. Suzhou UB Precision Display Test Equipment Sales (K Units), Revenue (M USD), Price (USD/Unit) and Gross Margin (2019-2025)
Table 127. Suzhou UB Precision Business Overview
Table 128. Suzhou UB Precision Recent Developments
Table 129. Shenzhen SEICHI Technologies Display Test Equipment Basic Information
Table 130. Shenzhen SEICHI Technologies Display Test Equipment Product Overview
Table 131. Shenzhen SEICHI Technologies Display Test Equipment Sales (K Units), Revenue (M USD), Price (USD/Unit) and Gross Margin (2019-2025)
Table 132. Shenzhen SEICHI Technologies Business Overview
Table 133. Shenzhen SEICHI Technologies Recent Developments
Table 134. Casivision Technology Display Test Equipment Basic Information
Table 135. Casivision Technology Display Test Equipment Product Overview
Table 136. Casivision Technology Display Test Equipment Sales (K Units), Revenue (M USD), Price (USD/Unit) and Gross Margin (2019-2025)
Table 137. Casivision Technology Business Overview
Table 138. Casivision Technology Recent Developments
Table 139. Global Display Test Equipment Sales Forecast by Region (2025-2032) & (K Units)
Table 140. Global Display Test Equipment Market Size Forecast by Region (2025-2032) & (M USD)
Table 141. North America Display Test Equipment Sales Forecast by Country (2025-2032) & (K Units)
Table 142. North America Display Test Equipment Market Size Forecast by Country (2025-2032) & (M USD)
Table 143. Europe Display Test Equipment Sales Forecast by Country (2025-2032) & (K Units)
Table 144. Europe Display Test Equipment Market Size Forecast by Country (2025-2032) & (M USD)
Table 145. Asia Pacific Display Test Equipment Sales Forecast by Region (2025-2032) & (K Units)
Table 146. Asia Pacific Display Test Equipment Market Size Forecast by Region (2025-2032) & (M USD)
Table 147. South America Display Test Equipment Sales Forecast by Country (2025-2032) & (K Units)
Table 148. South America Display Test Equipment Market Size Forecast by Country (2025-2032) & (M USD)
Table 149. Middle East and Africa Display Test Equipment Consumption Forecast by Country (2025-2032) & (Units)
Table 150. Middle East and Africa Display Test Equipment Market Size Forecast by Country (2025-2032) & (M USD)
Table 151. Global Display Test Equipment Sales Forecast by Type (2025-2032) & (K Units)
Table 152. Global Display Test Equipment Market Size Forecast by Type (2025-2032) & (M USD)
Table 153. Global Display Test Equipment Price Forecast by Type (2025-2032) & (USD/Unit)
Table 154. Global Display Test Equipment Sales (K Units) Forecast by Application (2025-2032)
Table 155. Global Display Test Equipment Market Size Forecast by Application (2025-2032) & (M USD)
List of Figures
Figure 1. Product Picture of Display Test Equipment
Figure 2. Data Triangulation
Figure 3. Key Caveats
Figure 4. Global Display Test Equipment Market Size (M USD), 2019-2032
Figure 5. Global Display Test Equipment Market Size (M USD) (2019-2032)
Figure 6. Global Display Test Equipment Sales (K Units) & (2019-2032)
Figure 7. Evaluation Matrix of Segment Market Development Potential (Type)
Figure 8. Evaluation Matrix of Segment Market Development Potential (Application)
Figure 9. Evaluation Matrix of Regional Market Development Potential
Figure 10. Display Test Equipment Market Size by Country (M USD)
Figure 11. Display Test Equipment Sales Share by Manufacturers in 2023
Figure 12. Global Display Test Equipment Revenue Share by Manufacturers in 2023
Figure 13. Display Test Equipment Market Share by Company Type (Tier 1, Tier 2 and Tier 3): 2023
Figure 14. Global Market Display Test Equipment Average Price (USD/Unit) of Key Manufacturers in 2023
Figure 15. The Global 5 and 10 Largest Players: Market Share by Display Test Equipment Revenue in 2023
Figure 16. Evaluation Matrix of Segment Market Development Potential (Type)
Figure 17. Global Display Test Equipment Market Share by Type
Figure 18. Sales Market Share of Display Test Equipment by Type (2019-2025)
Figure 19. Sales Market Share of Display Test Equipment by Type in 2023
Figure 20. Market Size Share of Display Test Equipment by Type (2019-2025)
Figure 21. Market Size Market Share of Display Test Equipment by Type in 2023
Figure 22. Evaluation Matrix of Segment Market Development Potential (Application)
Figure 23. Global Display Test Equipment Market Share by Application
Figure 24. Global Display Test Equipment Sales Market Share by Application (2019-2025)
Figure 25. Global Display Test Equipment Sales Market Share by Application in 2023
Figure 26. Global Display Test Equipment Market Share by Application (2019-2025)
Figure 27. Global Display Test Equipment Market Share by Application in 2023
Figure 28. Global Display Test Equipment Sales Growth Rate by Application (2019-2025)
Figure 29. Global Display Test Equipment Sales Market Share by Region (2019-2025)
Figure 30. North America Display Test Equipment Sales and Growth Rate (2019-2025) & (K Units)
Figure 31. North America Display Test Equipment Sales Market Share by Country in 2023
Figure 32. U.S. Display Test Equipment Sales and Growth Rate (2019-2025) & (K Units)
Figure 33. Canada Display Test Equipment Sales (K Units) and Growth Rate (2019-2025)
Figure 34. Mexico Display Test Equipment Sales (Units) and Growth Rate (2019-2025)
Figure 35. Europe Display Test Equipment Sales and Growth Rate (2019-2025) & (K Units)
Figure 36. Europe Display Test Equipment Sales Market Share by Country in 2023
Figure 37. Germany Display Test Equipment Sales and Growth Rate (2019-2025) & (K Units)
Figure 38. France Display Test Equipment Sales and Growth Rate (2019-2025) & (K Units)
Figure 39. U.K. Display Test Equipment Sales and Growth Rate (2019-2025) & (K Units)
Figure 40. Italy Display Test Equipment Sales and Growth Rate (2019-2025) & (K Units)
Figure 41. Russia Display Test Equipment Sales and Growth Rate (2019-2025) & (K Units)
Figure 42. Asia Pacific Display Test Equipment Sales and Growth Rate (K Units)
Figure 43. Asia Pacific Display Test Equipment Sales Market Share by Region in 2023
Figure 44. China Display Test Equipment Sales and Growth Rate (2019-2025) & (K Units)
Figure 45. Japan Display Test Equipment Sales and Growth Rate (2019-2025) & (K Units)
Figure 46. South Korea Display Test Equipment Sales and Growth Rate (2019-2025) & (K Units)
Figure 47. India Display Test Equipment Sales and Growth Rate (2019-2025) & (K Units)
Figure 48. Southeast Asia Display Test Equipment Sales and Growth Rate (2019-2025) & (K Units)
Figure 49. South America Display Test Equipment Sales and Growth Rate (K Units)
Figure 50. South America Display Test Equipment Sales Market Share by Country in 2023
Figure 51. Brazil Display Test Equipment Sales and Growth Rate (2019-2025) & (K Units)
Figure 52. Argentina Display Test Equipment Sales and Growth Rate (2019-2025) & (K Units)
Figure 53. Columbia Display Test Equipment Sales and Growth Rate (2019-2025) & (K Units)
Figure 54. Middle East and Africa Display Test Equipment Sales and Growth Rate (K Units)
Figure 55. Middle East and Africa Display Test Equipment Sales Market Share by Region in 2023
Figure 56. Saudi Arabia Display Test Equipment Sales and Growth Rate (2019-2025) & (K Units)
Figure 57. UAE Display Test Equipment Sales and Growth Rate (2019-2025) & (K Units)
Figure 58. Egypt Display Test Equipment Sales and Growth Rate (2019-2025) & (K Units)
Figure 59. Nigeria Display Test Equipment Sales and Growth Rate (2019-2025) & (K Units)
Figure 60. South Africa Display Test Equipment Sales and Growth Rate (2019-2025) & (K Units)
Figure 61. Global Display Test Equipment Production Market Share by Region (2019-2025)
Figure 62. North America Display Test Equipment Production (K Units) Growth Rate (2019-2025)
Figure 63. Europe Display Test Equipment Production (K Units) Growth Rate (2019-2025)
Figure 64. Japan Display Test Equipment Production (K Units) Growth Rate (2019-2025)
Figure 65. China Display Test Equipment Production (K Units) Growth Rate (2019-2025)
Figure 66. Global Display Test Equipment Sales Forecast by Volume (2019-2032) & (K Units)
Figure 67. Global Display Test Equipment Market Size Forecast by Value (2019-2032) & (M USD)
Figure 68. Global Display Test Equipment Sales Market Share Forecast by Type (2025-2032)
Figure 69. Global Display Test Equipment Market Share Forecast by Type (2025-2032)
Figure 70. Global Display Test Equipment Sales Forecast by Application (2025-2032)
Figure 71. Global Display Test Equipment Market Share Forecast by Application (2025-2032)

