The global fire-rated systems market encompasses a range of fire-resistant materials, structures, and systems designed to prevent, contain, and slow down the spread of fire. These systems include fire-rated doors, glass partitions, facades, curtain walls, and aluminum windows. They play a crucial role in enhancing safety measures in both residential and commercial buildings by ensuring compliance with fire safety regulations.
Market Size
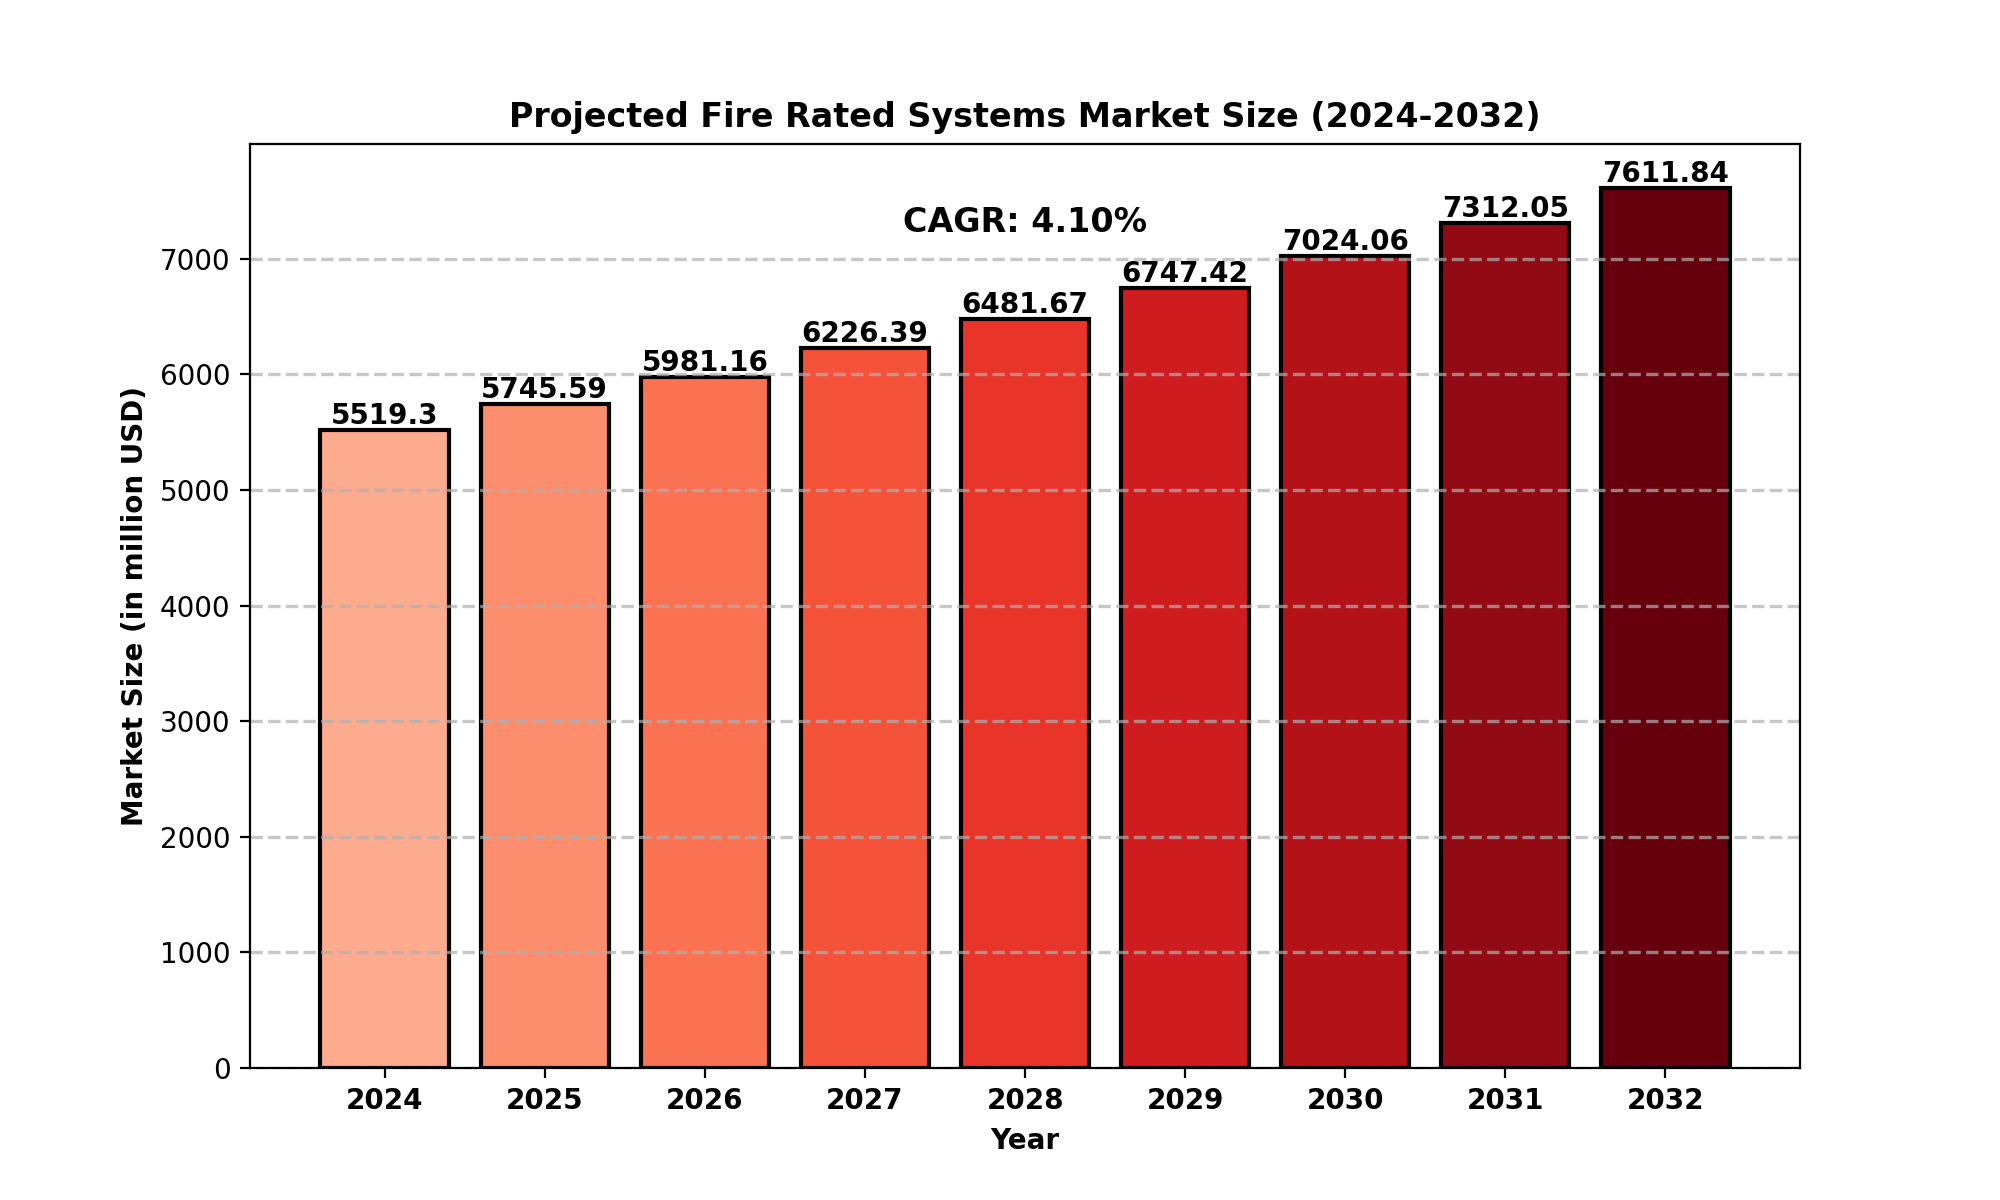
The global fire-rated systems market was valued at approximately USD 5519.30 million in 2024 and is projected to grow to USD 7611.84 million by 2032, reflecting a CAGR of 4.10% during the forecast period.
The North American market specifically is estimated to be worth USD 1541.03 million in 2024, growing at a CAGR of 3.51% from 2025 to 2032.
This growth is driven by stringent fire safety regulations, increasing construction activities, and growing awareness about fire safety solutions.
Market Dynamics (Drivers, Restraints, Opportunities, and Challenges)
Drivers
-
Strict Fire Safety Regulations: Governments worldwide are enforcing strict building codes and fire safety regulations, increasing the demand for fire-rated systems.
-
Growing Urbanization and Construction Activities: Rapid urban development and infrastructure projects boost market growth.
-
Increased Awareness and Adoption of Fire Safety Measures: Rising fire incidents have heightened the importance of fire-rated systems in residential and commercial spaces.
Restraints
-
High Initial Costs: Fire-rated systems require a significant investment, which can be a deterrent for small-scale construction projects.
-
Complex Installation Processes: The technical complexity of installing fire-rated structures can pose challenges.
Opportunities
-
Advancements in Fire-Resistant Materials: Technological innovations in materials like fire-resistant glass and insulation present growth prospects.
-
Expansion in Emerging Markets: Developing nations are increasingly adopting fire safety standards, creating new opportunities for market expansion.
Challenges
-
Lack of Awareness in Developing Regions: Many regions still lack proper fire safety standards, slowing market penetration.
-
Regulatory Compliance Issues: Adhering to different regional safety codes and certifications can be a challenge for manufacturers.
Regional Analysis
North America
Europe
Asia-Pacific
-
Rapid urbanization, industrialization, and government initiatives for fire safety regulations fuel market growth.
-
China, Japan, and India are leading contributors to market expansion.
South America
Middle East & Africa
Competitor Analysis
Major players in the fire-rated systems market include:
These companies focus on product innovations, partnerships, and strategic expansions to maintain a competitive edge.
Market Segmentation (by Application)
-
Household: Growing demand for fire-resistant doors, windows, and insulation materials in residential buildings.
-
Commercial: High adoption of fire-rated facades, partitions, and curtain walls in offices, malls, and hotels.
-
Others: Industrial and institutional buildings requiring fire-rated solutions.
Market Segmentation (by Type)
Geographic Segmentation
-
North America (USA, Canada, Mexico)
-
Europe (Germany, UK, France, Russia, Italy, Rest of Europe)
-
Asia-Pacific (China, Japan, South Korea, India, Southeast Asia, Rest of Asia-Pacific)
-
South America (Brazil, Argentina, Columbia, Rest of South America)
-
Middle East and Africa (Saudi Arabia, UAE, Egypt, Nigeria, South Africa, Rest of MEA)
FAQ Section
What is the current market size of the global Fire Rated Systems market?
- The market is valued at USD 5519.30 million in 2024 and is projected to reach USD 7611.84 million by 2032 with a 4.10% CAGR.
Which are the key companies operating in the Fire Rated Systems market?
- Leading companies include Winstone Wallboards, ClarkDietrich Building Systems, Manko, Erie Metal Specialties, Panel Built, and VETROTECH.
What are the key growth drivers in the Fire Rated Systems market?
- Growth is driven by strict fire safety regulations, increasing urbanization, and technological advancements in fire-resistant materials.
Which regions dominate the Fire Rated Systems market?
- North America and Europe are key regions due to stringent regulations and high adoption rates. Asia-Pacific is growing rapidly due to urbanization and increasing fire safety awareness.
What are the emerging trends in the Fire Rated Systems market?
- Key trends include innovation in fire-resistant materials, increased investments in smart buildings, and expansion in emerging markets.
Key Benefits of This Market Research:
-
Industry drivers, restraints, and opportunities covered in the study
-
Neutral perspective on the market performance
-
Recent industry trends and developments
-
Competitive landscape & strategies of key players
-
Potential & niche segments and regions exhibiting promising growth covered
-
Historical, current, and projected market size, in terms of value
-
In-depth analysis of the Fire Rated Systems Market
-
Overview of the regional outlook of the Fire Rated Systems Market:
Key Reasons to Buy this Report:
-
Access to date statistics compiled by our researchers. These provide you with historical and forecast data, which is analyzed to tell you why your market is set to change
-
This enables you to anticipate market changes to remain ahead of your competitors
-
You will be able to copy data from the Excel spreadsheet straight into your marketing plans, business presentations, or other strategic documents
-
The concise analysis, clear graph, and table format will enable you to pinpoint the information you require quickly
-
Provision of market value data for each segment and sub-segment
-
Indicates the region and segment that is expected to witness the fastest growth as well as to dominate the market
-
Analysis by geography highlighting the consumption of the product/service in the region as well as indicating the factors that are affecting the market within each region
-
Competitive landscape which incorporates the market ranking of the major players, along with new service/product launches, partnerships, business expansions, and acquisitions in the past five years of companies profiled
-
Extensive company profiles comprising of company overview, company insights, product benchmarking, and SWOT analysis for the major market players
-
The current as well as the future market outlook of the industry concerning recent developments which involve growth opportunities and drivers as well as challenges and restraints of both emerging as well as developed regions
-
Includes in-depth analysis of the market from various perspectives through Porters five forces analysis
-
Provides insight into the market through Value Chain
-
Market dynamics scenario, along with growth opportunities of the market in the years to come
-
6-month post-sales analyst support
Customization of the Report
Chapter Outline
-
Chapter 1 mainly introduces the statistical scope of the report, market division standards, and market research methods.
-
Chapter 2 is an executive summary of different market segments (by region, product type, application, etc), including the market size of each market segment, future development potential, and so on. It offers a high-level view of the current state of the Fire Rated Systems Market and its likely evolution in the short to mid-term, and long term.
-
Chapter 3 makes a detailed analysis of the market's competitive landscape of the market and provides the market share, capacity, output, price, latest development plan, merger, and acquisition information of the main manufacturers in the market.
-
Chapter 4 is the analysis of the whole market industrial chain, including the upstream and downstream of the industry, as well as Porter's five forces analysis.
-
Chapter 5 introduces the latest developments of the market, the driving factors and restrictive factors of the market, the challenges and risks faced by manufacturers in the industry, and the analysis of relevant policies in the industry.
-
Chapter 6 provides the analysis of various market segments according to product types, covering the market size and development potential of each market segment, to help readers find the blue ocean market in different market segments.
-
Chapter 7 provides the analysis of various market segments according to application, covering the market size and development potential of each market segment, to help readers find the blue ocean market in different downstream markets.
-
Chapter 8 provides a quantitative analysis of the market size and development potential of each region from the consumer side and its main countries and introduces the market development, future development prospects, market space, and capacity of each country in the world.
-
Chapter 9 shares the main producing countries of Fire Rated Systems, their output value, profit level, regional supply, production capacity layout, etc. from the supply side.
-
Chapter 10 introduces the basic situation of the main companies in the market in detail, including product sales revenue, sales volume, price, gross profit margin, market share, product introduction, recent development, etc.
-
Chapter 11 provides a quantitative analysis of the market size and development potential of each region during the forecast period.
-
Chapter 12 provides a quantitative analysis of the market size and development potential of each market segment during the forecast period.
-
Chapter 13 is the main points and conclusions of the report.
TABLE OF CONTENTS
Table of Contents
1 Research Methodology and Statistical Scope
1.1 Market Definition and Statistical Scope of Fire Rated Systems
1.2 Key Market Segments
1.2.1 Fire Rated Systems Segment by Type
1.2.2 Fire Rated Systems Segment by Application
1.3 Methodology & Sources of Information
1.3.1 Research Methodology
1.3.2 Research Process
1.3.3 Market Breakdown and Data Triangulation
1.3.4 Base Year
1.3.5 Report Assumptions & Caveats
2 Fire Rated Systems Market Overview
2.1 Global Market Overview
2.1.1 Global Fire Rated Systems Market Size (M USD) Estimates and Forecasts (2019-2032)
2.1.2 Global Fire Rated Systems Sales Estimates and Forecasts (2019-2032)
2.2 Market Segment Executive Summary
2.3 Global Market Size by Region
3 Fire Rated Systems Market Competitive Landscape
3.1 Global Fire Rated Systems Sales by Manufacturers (2019-2025)
3.2 Global Fire Rated Systems Revenue Market Share by Manufacturers (2019-2025)
3.3 Fire Rated Systems Market Share by Company Type (Tier 1, Tier 2, and Tier 3)
3.4 Global Fire Rated Systems Average Price by Manufacturers (2019-2025)
3.5 Manufacturers Fire Rated Systems Sales Sites, Area Served, Product Type
3.6 Fire Rated Systems Market Competitive Situation and Trends
3.6.1 Fire Rated Systems Market Concentration Rate
3.6.2 Global 5 and 10 Largest Fire Rated Systems Players Market Share by Revenue
3.6.3 Mergers & Acquisitions, Expansion
4 Fire Rated Systems Industry Chain Analysis
4.1 Fire Rated Systems Industry Chain Analysis
4.2 Market Overview of Key Raw Materials
4.3 Midstream Market Analysis
4.4 Downstream Customer Analysis
5 The Development and Dynamics of Fire Rated Systems Market
5.1 Key Development Trends
5.2 Driving Factors
5.3 Market Challenges
5.4 Market Restraints
5.5 Industry News
5.5.1 New Product Developments
5.5.2 Mergers & Acquisitions
5.5.3 Expansions
5.5.4 Collaboration/Supply Contracts
5.6 Industry Policies
6 Fire Rated Systems Market Segmentation by Type
6.1 Evaluation Matrix of Segment Market Development Potential (Type)
6.2 Global Fire Rated Systems Sales Market Share by Type (2019-2025)
6.3 Global Fire Rated Systems Market Size Market Share by Type (2019-2025)
6.4 Global Fire Rated Systems Price by Type (2019-2025)
7 Fire Rated Systems Market Segmentation by Application
7.1 Evaluation Matrix of Segment Market Development Potential (Application)
7.2 Global Fire Rated Systems Market Sales by Application (2019-2025)
7.3 Global Fire Rated Systems Market Size (M USD) by Application (2019-2025)
7.4 Global Fire Rated Systems Sales Growth Rate by Application (2019-2025)
8 Fire Rated Systems Market Consumption by Region
8.1 Global Fire Rated Systems Sales by Region
8.1.1 Global Fire Rated Systems Sales by Region
8.1.2 Global Fire Rated Systems Sales Market Share by Region
8.2 North America
8.2.1 North America Fire Rated Systems Sales by Country
8.2.2 U.S.
8.2.3 Canada
8.2.4 Mexico
8.3 Europe
8.3.1 Europe Fire Rated Systems Sales by Country
8.3.2 Germany
8.3.3 France
8.3.4 U.K.
8.3.5 Italy
8.3.6 Russia
8.4 Asia Pacific
8.4.1 Asia Pacific Fire Rated Systems Sales by Region
8.4.2 China
8.4.3 Japan
8.4.4 South Korea
8.4.5 India
8.4.6 Southeast Asia
8.5 South America
8.5.1 South America Fire Rated Systems Sales by Country
8.5.2 Brazil
8.5.3 Argentina
8.5.4 Columbia
8.6 Middle East and Africa
8.6.1 Middle East and Africa Fire Rated Systems Sales by Region
8.6.2 Saudi Arabia
8.6.3 UAE
8.6.4 Egypt
8.6.5 Nigeria
8.6.6 South Africa
9 Fire Rated Systems Market Production by Region
9.1 Global Production of Fire Rated Systems by Region (2019-2025)
9.2 Global Fire Rated Systems Revenue Market Share by Region (2019-2025)
9.3 Global Fire Rated Systems Production, Revenue, Price and Gross Margin (2019-2025)
9.4 North America Fire Rated Systems Production
9.4.1 North America Fire Rated Systems Production Growth Rate (2019-2025)
9.4.2 North America Fire Rated Systems Production, Revenue, Price and Gross Margin (2019-2025)
9.5 Europe Fire Rated Systems Production
9.5.1 Europe Fire Rated Systems Production Growth Rate (2019-2025)
9.5.2 Europe Fire Rated Systems Production, Revenue, Price and Gross Margin (2019-2025)
9.6 Japan Fire Rated Systems Production (2019-2025)
9.6.1 Japan Fire Rated Systems Production Growth Rate (2019-2025)
9.6.2 Japan Fire Rated Systems Production, Revenue, Price and Gross Margin (2019-2025)
9.7 China Fire Rated Systems Production (2019-2025)
9.7.1 China Fire Rated Systems Production Growth Rate (2019-2025)
9.7.2 China Fire Rated Systems Production, Revenue, Price and Gross Margin (2019-2025)
10 Key Companies Profile
10.1 Winstone Wallboards
10.1.1 Winstone Wallboards Fire Rated Systems Basic Information
10.1.2 Winstone Wallboards Fire Rated Systems Product Overview
10.1.3 Winstone Wallboards Fire Rated Systems Product Market Performance
10.1.4 Winstone Wallboards Business Overview
10.1.5 Winstone Wallboards Fire Rated Systems SWOT Analysis
10.1.6 Winstone Wallboards Recent Developments
10.2 ClarkDietrich Building Systems
10.2.1 ClarkDietrich Building Systems Fire Rated Systems Basic Information
10.2.2 ClarkDietrich Building Systems Fire Rated Systems Product Overview
10.2.3 ClarkDietrich Building Systems Fire Rated Systems Product Market Performance
10.2.4 ClarkDietrich Building Systems Business Overview
10.2.5 ClarkDietrich Building Systems Fire Rated Systems SWOT Analysis
10.2.6 ClarkDietrich Building Systems Recent Developments
10.3 Manko
10.3.1 Manko Fire Rated Systems Basic Information
10.3.2 Manko Fire Rated Systems Product Overview
10.3.3 Manko Fire Rated Systems Product Market Performance
10.3.4 Manko Fire Rated Systems SWOT Analysis
10.3.5 Manko Business Overview
10.3.6 Manko Recent Developments
10.4 Erie Metal Specialties
10.4.1 Erie Metal Specialties Fire Rated Systems Basic Information
10.4.2 Erie Metal Specialties Fire Rated Systems Product Overview
10.4.3 Erie Metal Specialties Fire Rated Systems Product Market Performance
10.4.4 Erie Metal Specialties Business Overview
10.4.5 Erie Metal Specialties Recent Developments
10.5 Inc
10.5.1 Inc Fire Rated Systems Basic Information
10.5.2 Inc Fire Rated Systems Product Overview
10.5.3 Inc Fire Rated Systems Product Market Performance
10.5.4 Inc Business Overview
10.5.5 Inc Recent Developments
10.6 Panel Built
10.6.1 Panel Built Fire Rated Systems Basic Information
10.6.2 Panel Built Fire Rated Systems Product Overview
10.6.3 Panel Built Fire Rated Systems Product Market Performance
10.6.4 Panel Built Business Overview
10.6.5 Panel Built Recent Developments
10.7 Hours and Info
10.7.1 Hours and Info Fire Rated Systems Basic Information
10.7.2 Hours and Info Fire Rated Systems Product Overview
10.7.3 Hours and Info Fire Rated Systems Product Market Performance
10.7.4 Hours and Info Business Overview
10.7.5 Hours and Info Recent Developments
10.8 Latham
10.8.1 Latham Fire Rated Systems Basic Information
10.8.2 Latham Fire Rated Systems Product Overview
10.8.3 Latham Fire Rated Systems Product Market Performance
10.8.4 Latham Business Overview
10.8.5 Latham Recent Developments
10.9 Hadrian Window Systems
10.9.1 Hadrian Window Systems Fire Rated Systems Basic Information
10.9.2 Hadrian Window Systems Fire Rated Systems Product Overview
10.9.3 Hadrian Window Systems Fire Rated Systems Product Market Performance
10.9.4 Hadrian Window Systems Business Overview
10.9.5 Hadrian Window Systems Recent Developments
10.10 VETROTECH
10.10.1 VETROTECH Fire Rated Systems Basic Information
10.10.2 VETROTECH Fire Rated Systems Product Overview
10.10.3 VETROTECH Fire Rated Systems Product Market Performance
10.10.4 VETROTECH Business Overview
10.10.5 VETROTECH Recent Developments
10.11 KOPOS KOLIN
10.11.1 KOPOS KOLIN Fire Rated Systems Basic Information
10.11.2 KOPOS KOLIN Fire Rated Systems Product Overview
10.11.3 KOPOS KOLIN Fire Rated Systems Product Market Performance
10.11.4 KOPOS KOLIN Business Overview
10.11.5 KOPOS KOLIN Recent Developments
10.12 Dysart Timbers Ltd
10.12.1 Dysart Timbers Ltd Fire Rated Systems Basic Information
10.12.2 Dysart Timbers Ltd Fire Rated Systems Product Overview
10.12.3 Dysart Timbers Ltd Fire Rated Systems Product Market Performance
10.12.4 Dysart Timbers Ltd Business Overview
10.12.5 Dysart Timbers Ltd Recent Developments
11 Fire Rated Systems Market Forecast by Region
11.1 Global Fire Rated Systems Market Size Forecast
11.2 Global Fire Rated Systems Market Forecast by Region
11.2.1 North America Market Size Forecast by Country
11.2.2 Europe Fire Rated Systems Market Size Forecast by Country
11.2.3 Asia Pacific Fire Rated Systems Market Size Forecast by Region
11.2.4 South America Fire Rated Systems Market Size Forecast by Country
11.2.5 Middle East and Africa Forecasted Consumption of Fire Rated Systems by Country
12 Forecast Market by Type and by Application (2025-2032)
12.1 Global Fire Rated Systems Market Forecast by Type (2025-2032)
12.1.1 Global Forecasted Sales of Fire Rated Systems by Type (2025-2032)
12.1.2 Global Fire Rated Systems Market Size Forecast by Type (2025-2032)
12.1.3 Global Forecasted Price of Fire Rated Systems by Type (2025-2032)
12.2 Global Fire Rated Systems Market Forecast by Application (2025-2032)
12.2.1 Global Fire Rated Systems Sales (K Units) Forecast by Application
12.2.2 Global Fire Rated Systems Market Size (M USD) Forecast by Application (2025-2032)
13 Conclusion and Key Findings
LIST OF TABLES & FIGURES
List of Tables
Table 1. Introduction of the Type
Table 2. Introduction of the Application
Table 3. Market Size (M USD) Segment Executive Summary
Table 4. Fire Rated Systems Market Size Comparison by Region (M USD)
Table 5. Global Fire Rated Systems Sales (K Units) by Manufacturers (2019-2025)
Table 6. Global Fire Rated Systems Sales Market Share by Manufacturers (2019-2025)
Table 7. Global Fire Rated Systems Revenue (M USD) by Manufacturers (2019-2025)
Table 8. Global Fire Rated Systems Revenue Share by Manufacturers (2019-2025)
Table 9. Company Type (Tier 1, Tier 2, and Tier 3) & (based on the Revenue in Fire Rated Systems as of 2022)
Table 10. Global Market Fire Rated Systems Average Price (USD/Unit) of Key Manufacturers (2019-2025)
Table 11. Manufacturers Fire Rated Systems Sales Sites and Area Served
Table 12. Manufacturers Fire Rated Systems Product Type
Table 13. Global Fire Rated Systems Manufacturers Market Concentration Ratio (CR5 and HHI)
Table 14. Mergers & Acquisitions, Expansion Plans
Table 15. Industry Chain Map of Fire Rated Systems
Table 16. Market Overview of Key Raw Materials
Table 17. Midstream Market Analysis
Table 18. Downstream Customer Analysis
Table 19. Key Development Trends
Table 20. Driving Factors
Table 21. Fire Rated Systems Market Challenges
Table 22. Global Fire Rated Systems Sales by Type (K Units)
Table 23. Global Fire Rated Systems Market Size by Type (M USD)
Table 24. Global Fire Rated Systems Sales (K Units) by Type (2019-2025)
Table 25. Global Fire Rated Systems Sales Market Share by Type (2019-2025)
Table 26. Global Fire Rated Systems Market Size (M USD) by Type (2019-2025)
Table 27. Global Fire Rated Systems Market Size Share by Type (2019-2025)
Table 28. Global Fire Rated Systems Price (USD/Unit) by Type (2019-2025)
Table 29. Global Fire Rated Systems Sales (K Units) by Application
Table 30. Global Fire Rated Systems Market Size by Application
Table 31. Global Fire Rated Systems Sales by Application (2019-2025) & (K Units)
Table 32. Global Fire Rated Systems Sales Market Share by Application (2019-2025)
Table 33. Global Fire Rated Systems Sales by Application (2019-2025) & (M USD)
Table 34. Global Fire Rated Systems Market Share by Application (2019-2025)
Table 35. Global Fire Rated Systems Sales Growth Rate by Application (2019-2025)
Table 36. Global Fire Rated Systems Sales by Region (2019-2025) & (K Units)
Table 37. Global Fire Rated Systems Sales Market Share by Region (2019-2025)
Table 38. North America Fire Rated Systems Sales by Country (2019-2025) & (K Units)
Table 39. Europe Fire Rated Systems Sales by Country (2019-2025) & (K Units)
Table 40. Asia Pacific Fire Rated Systems Sales by Region (2019-2025) & (K Units)
Table 41. South America Fire Rated Systems Sales by Country (2019-2025) & (K Units)
Table 42. Middle East and Africa Fire Rated Systems Sales by Region (2019-2025) & (K Units)
Table 43. Global Fire Rated Systems Production (K Units) by Region (2019-2025)
Table 44. Global Fire Rated Systems Revenue (US$ Million) by Region (2019-2025)
Table 45. Global Fire Rated Systems Revenue Market Share by Region (2019-2025)
Table 46. Global Fire Rated Systems Production (K Units), Revenue (US$ Million), Price (USD/Unit) and Gross Margin (2019-2025)
Table 47. North America Fire Rated Systems Production (K Units), Revenue (US$ Million), Price (USD/Unit) and Gross Margin (2019-2025)
Table 48. Europe Fire Rated Systems Production (K Units), Revenue (US$ Million), Price (USD/Unit) and Gross Margin (2019-2025)
Table 49. Japan Fire Rated Systems Production (K Units), Revenue (US$ Million), Price (USD/Unit) and Gross Margin (2019-2025)
Table 50. China Fire Rated Systems Production (K Units), Revenue (US$ Million), Price (USD/Unit) and Gross Margin (2019-2025)
Table 51. Winstone Wallboards Fire Rated Systems Basic Information
Table 52. Winstone Wallboards Fire Rated Systems Product Overview
Table 53. Winstone Wallboards Fire Rated Systems Sales (K Units), Revenue (M USD), Price (USD/Unit) and Gross Margin (2019-2025)
Table 54. Winstone Wallboards Business Overview
Table 55. Winstone Wallboards Fire Rated Systems SWOT Analysis
Table 56. Winstone Wallboards Recent Developments
Table 57. ClarkDietrich Building Systems Fire Rated Systems Basic Information
Table 58. ClarkDietrich Building Systems Fire Rated Systems Product Overview
Table 59. ClarkDietrich Building Systems Fire Rated Systems Sales (K Units), Revenue (M USD), Price (USD/Unit) and Gross Margin (2019-2025)
Table 60. ClarkDietrich Building Systems Business Overview
Table 61. ClarkDietrich Building Systems Fire Rated Systems SWOT Analysis
Table 62. ClarkDietrich Building Systems Recent Developments
Table 63. Manko Fire Rated Systems Basic Information
Table 64. Manko Fire Rated Systems Product Overview
Table 65. Manko Fire Rated Systems Sales (K Units), Revenue (M USD), Price (USD/Unit) and Gross Margin (2019-2025)
Table 66. Manko Fire Rated Systems SWOT Analysis
Table 67. Manko Business Overview
Table 68. Manko Recent Developments
Table 69. Erie Metal Specialties Fire Rated Systems Basic Information
Table 70. Erie Metal Specialties Fire Rated Systems Product Overview
Table 71. Erie Metal Specialties Fire Rated Systems Sales (K Units), Revenue (M USD), Price (USD/Unit) and Gross Margin (2019-2025)
Table 72. Erie Metal Specialties Business Overview
Table 73. Erie Metal Specialties Recent Developments
Table 74. Inc Fire Rated Systems Basic Information
Table 75. Inc Fire Rated Systems Product Overview
Table 76. Inc Fire Rated Systems Sales (K Units), Revenue (M USD), Price (USD/Unit) and Gross Margin (2019-2025)
Table 77. Inc Business Overview
Table 78. Inc Recent Developments
Table 79. Panel Built Fire Rated Systems Basic Information
Table 80. Panel Built Fire Rated Systems Product Overview
Table 81. Panel Built Fire Rated Systems Sales (K Units), Revenue (M USD), Price (USD/Unit) and Gross Margin (2019-2025)
Table 82. Panel Built Business Overview
Table 83. Panel Built Recent Developments
Table 84. Hours and Info Fire Rated Systems Basic Information
Table 85. Hours and Info Fire Rated Systems Product Overview
Table 86. Hours and Info Fire Rated Systems Sales (K Units), Revenue (M USD), Price (USD/Unit) and Gross Margin (2019-2025)
Table 87. Hours and Info Business Overview
Table 88. Hours and Info Recent Developments
Table 89. Latham Fire Rated Systems Basic Information
Table 90. Latham Fire Rated Systems Product Overview
Table 91. Latham Fire Rated Systems Sales (K Units), Revenue (M USD), Price (USD/Unit) and Gross Margin (2019-2025)
Table 92. Latham Business Overview
Table 93. Latham Recent Developments
Table 94. Hadrian Window Systems Fire Rated Systems Basic Information
Table 95. Hadrian Window Systems Fire Rated Systems Product Overview
Table 96. Hadrian Window Systems Fire Rated Systems Sales (K Units), Revenue (M USD), Price (USD/Unit) and Gross Margin (2019-2025)
Table 97. Hadrian Window Systems Business Overview
Table 98. Hadrian Window Systems Recent Developments
Table 99. VETROTECH Fire Rated Systems Basic Information
Table 100. VETROTECH Fire Rated Systems Product Overview
Table 101. VETROTECH Fire Rated Systems Sales (K Units), Revenue (M USD), Price (USD/Unit) and Gross Margin (2019-2025)
Table 102. VETROTECH Business Overview
Table 103. VETROTECH Recent Developments
Table 104. KOPOS KOLIN Fire Rated Systems Basic Information
Table 105. KOPOS KOLIN Fire Rated Systems Product Overview
Table 106. KOPOS KOLIN Fire Rated Systems Sales (K Units), Revenue (M USD), Price (USD/Unit) and Gross Margin (2019-2025)
Table 107. KOPOS KOLIN Business Overview
Table 108. KOPOS KOLIN Recent Developments
Table 109. Dysart Timbers Ltd Fire Rated Systems Basic Information
Table 110. Dysart Timbers Ltd Fire Rated Systems Product Overview
Table 111. Dysart Timbers Ltd Fire Rated Systems Sales (K Units), Revenue (M USD), Price (USD/Unit) and Gross Margin (2019-2025)
Table 112. Dysart Timbers Ltd Business Overview
Table 113. Dysart Timbers Ltd Recent Developments
Table 114. Global Fire Rated Systems Sales Forecast by Region (2025-2032) & (K Units)
Table 115. Global Fire Rated Systems Market Size Forecast by Region (2025-2032) & (M USD)
Table 116. North America Fire Rated Systems Sales Forecast by Country (2025-2032) & (K Units)
Table 117. North America Fire Rated Systems Market Size Forecast by Country (2025-2032) & (M USD)
Table 118. Europe Fire Rated Systems Sales Forecast by Country (2025-2032) & (K Units)
Table 119. Europe Fire Rated Systems Market Size Forecast by Country (2025-2032) & (M USD)
Table 120. Asia Pacific Fire Rated Systems Sales Forecast by Region (2025-2032) & (K Units)
Table 121. Asia Pacific Fire Rated Systems Market Size Forecast by Region (2025-2032) & (M USD)
Table 122. South America Fire Rated Systems Sales Forecast by Country (2025-2032) & (K Units)
Table 123. South America Fire Rated Systems Market Size Forecast by Country (2025-2032) & (M USD)
Table 124. Middle East and Africa Fire Rated Systems Consumption Forecast by Country (2025-2032) & (Units)
Table 125. Middle East and Africa Fire Rated Systems Market Size Forecast by Country (2025-2032) & (M USD)
Table 126. Global Fire Rated Systems Sales Forecast by Type (2025-2032) & (K Units)
Table 127. Global Fire Rated Systems Market Size Forecast by Type (2025-2032) & (M USD)
Table 128. Global Fire Rated Systems Price Forecast by Type (2025-2032) & (USD/Unit)
Table 129. Global Fire Rated Systems Sales (K Units) Forecast by Application (2025-2032)
Table 130. Global Fire Rated Systems Market Size Forecast by Application (2025-2032) & (M USD)
List of Figures
Figure 1. Product Picture of Fire Rated Systems
Figure 2. Data Triangulation
Figure 3. Key Caveats
Figure 4. Global Fire Rated Systems Market Size (M USD), 2019-2032
Figure 5. Global Fire Rated Systems Market Size (M USD) (2019-2032)
Figure 6. Global Fire Rated Systems Sales (K Units) & (2019-2032)
Figure 7. Evaluation Matrix of Segment Market Development Potential (Type)
Figure 8. Evaluation Matrix of Segment Market Development Potential (Application)
Figure 9. Evaluation Matrix of Regional Market Development Potential
Figure 10. Fire Rated Systems Market Size by Country (M USD)
Figure 11. Fire Rated Systems Sales Share by Manufacturers in 2023
Figure 12. Global Fire Rated Systems Revenue Share by Manufacturers in 2023
Figure 13. Fire Rated Systems Market Share by Company Type (Tier 1, Tier 2 and Tier 3): 2023
Figure 14. Global Market Fire Rated Systems Average Price (USD/Unit) of Key Manufacturers in 2023
Figure 15. The Global 5 and 10 Largest Players: Market Share by Fire Rated Systems Revenue in 2023
Figure 16. Evaluation Matrix of Segment Market Development Potential (Type)
Figure 17. Global Fire Rated Systems Market Share by Type
Figure 18. Sales Market Share of Fire Rated Systems by Type (2019-2025)
Figure 19. Sales Market Share of Fire Rated Systems by Type in 2023
Figure 20. Market Size Share of Fire Rated Systems by Type (2019-2025)
Figure 21. Market Size Market Share of Fire Rated Systems by Type in 2023
Figure 22. Evaluation Matrix of Segment Market Development Potential (Application)
Figure 23. Global Fire Rated Systems Market Share by Application
Figure 24. Global Fire Rated Systems Sales Market Share by Application (2019-2025)
Figure 25. Global Fire Rated Systems Sales Market Share by Application in 2023
Figure 26. Global Fire Rated Systems Market Share by Application (2019-2025)
Figure 27. Global Fire Rated Systems Market Share by Application in 2023
Figure 28. Global Fire Rated Systems Sales Growth Rate by Application (2019-2025)
Figure 29. Global Fire Rated Systems Sales Market Share by Region (2019-2025)
Figure 30. North America Fire Rated Systems Sales and Growth Rate (2019-2025) & (K Units)
Figure 31. North America Fire Rated Systems Sales Market Share by Country in 2023
Figure 32. U.S. Fire Rated Systems Sales and Growth Rate (2019-2025) & (K Units)
Figure 33. Canada Fire Rated Systems Sales (K Units) and Growth Rate (2019-2025)
Figure 34. Mexico Fire Rated Systems Sales (Units) and Growth Rate (2019-2025)
Figure 35. Europe Fire Rated Systems Sales and Growth Rate (2019-2025) & (K Units)
Figure 36. Europe Fire Rated Systems Sales Market Share by Country in 2023
Figure 37. Germany Fire Rated Systems Sales and Growth Rate (2019-2025) & (K Units)
Figure 38. France Fire Rated Systems Sales and Growth Rate (2019-2025) & (K Units)
Figure 39. U.K. Fire Rated Systems Sales and Growth Rate (2019-2025) & (K Units)
Figure 40. Italy Fire Rated Systems Sales and Growth Rate (2019-2025) & (K Units)
Figure 41. Russia Fire Rated Systems Sales and Growth Rate (2019-2025) & (K Units)
Figure 42. Asia Pacific Fire Rated Systems Sales and Growth Rate (K Units)
Figure 43. Asia Pacific Fire Rated Systems Sales Market Share by Region in 2023
Figure 44. China Fire Rated Systems Sales and Growth Rate (2019-2025) & (K Units)
Figure 45. Japan Fire Rated Systems Sales and Growth Rate (2019-2025) & (K Units)
Figure 46. South Korea Fire Rated Systems Sales and Growth Rate (2019-2025) & (K Units)
Figure 47. India Fire Rated Systems Sales and Growth Rate (2019-2025) & (K Units)
Figure 48. Southeast Asia Fire Rated Systems Sales and Growth Rate (2019-2025) & (K Units)
Figure 49. South America Fire Rated Systems Sales and Growth Rate (K Units)
Figure 50. South America Fire Rated Systems Sales Market Share by Country in 2023
Figure 51. Brazil Fire Rated Systems Sales and Growth Rate (2019-2025) & (K Units)
Figure 52. Argentina Fire Rated Systems Sales and Growth Rate (2019-2025) & (K Units)
Figure 53. Columbia Fire Rated Systems Sales and Growth Rate (2019-2025) & (K Units)
Figure 54. Middle East and Africa Fire Rated Systems Sales and Growth Rate (K Units)
Figure 55. Middle East and Africa Fire Rated Systems Sales Market Share by Region in 2023
Figure 56. Saudi Arabia Fire Rated Systems Sales and Growth Rate (2019-2025) & (K Units)
Figure 57. UAE Fire Rated Systems Sales and Growth Rate (2019-2025) & (K Units)
Figure 58. Egypt Fire Rated Systems Sales and Growth Rate (2019-2025) & (K Units)
Figure 59. Nigeria Fire Rated Systems Sales and Growth Rate (2019-2025) & (K Units)
Figure 60. South Africa Fire Rated Systems Sales and Growth Rate (2019-2025) & (K Units)
Figure 61. Global Fire Rated Systems Production Market Share by Region (2019-2025)
Figure 62. North America Fire Rated Systems Production (K Units) Growth Rate (2019-2025)
Figure 63. Europe Fire Rated Systems Production (K Units) Growth Rate (2019-2025)
Figure 64. Japan Fire Rated Systems Production (K Units) Growth Rate (2019-2025)
Figure 65. China Fire Rated Systems Production (K Units) Growth Rate (2019-2025)
Figure 66. Global Fire Rated Systems Sales Forecast by Volume (2019-2032) & (K Units)
Figure 67. Global Fire Rated Systems Market Size Forecast by Value (2019-2032) & (M USD)
Figure 68. Global Fire Rated Systems Sales Market Share Forecast by Type (2025-2032)
Figure 69. Global Fire Rated Systems Market Share Forecast by Type (2025-2032)
Figure 70. Global Fire Rated Systems Sales Forecast by Application (2025-2032)
Figure 71. Global Fire Rated Systems Market Share Forecast by Application (2025-2032)

